Bed Bath & Beyond Results Presentation Deck
FINANCIAL OUTLOOK
fast-paced transformation underway to re-establish authority
in home
●
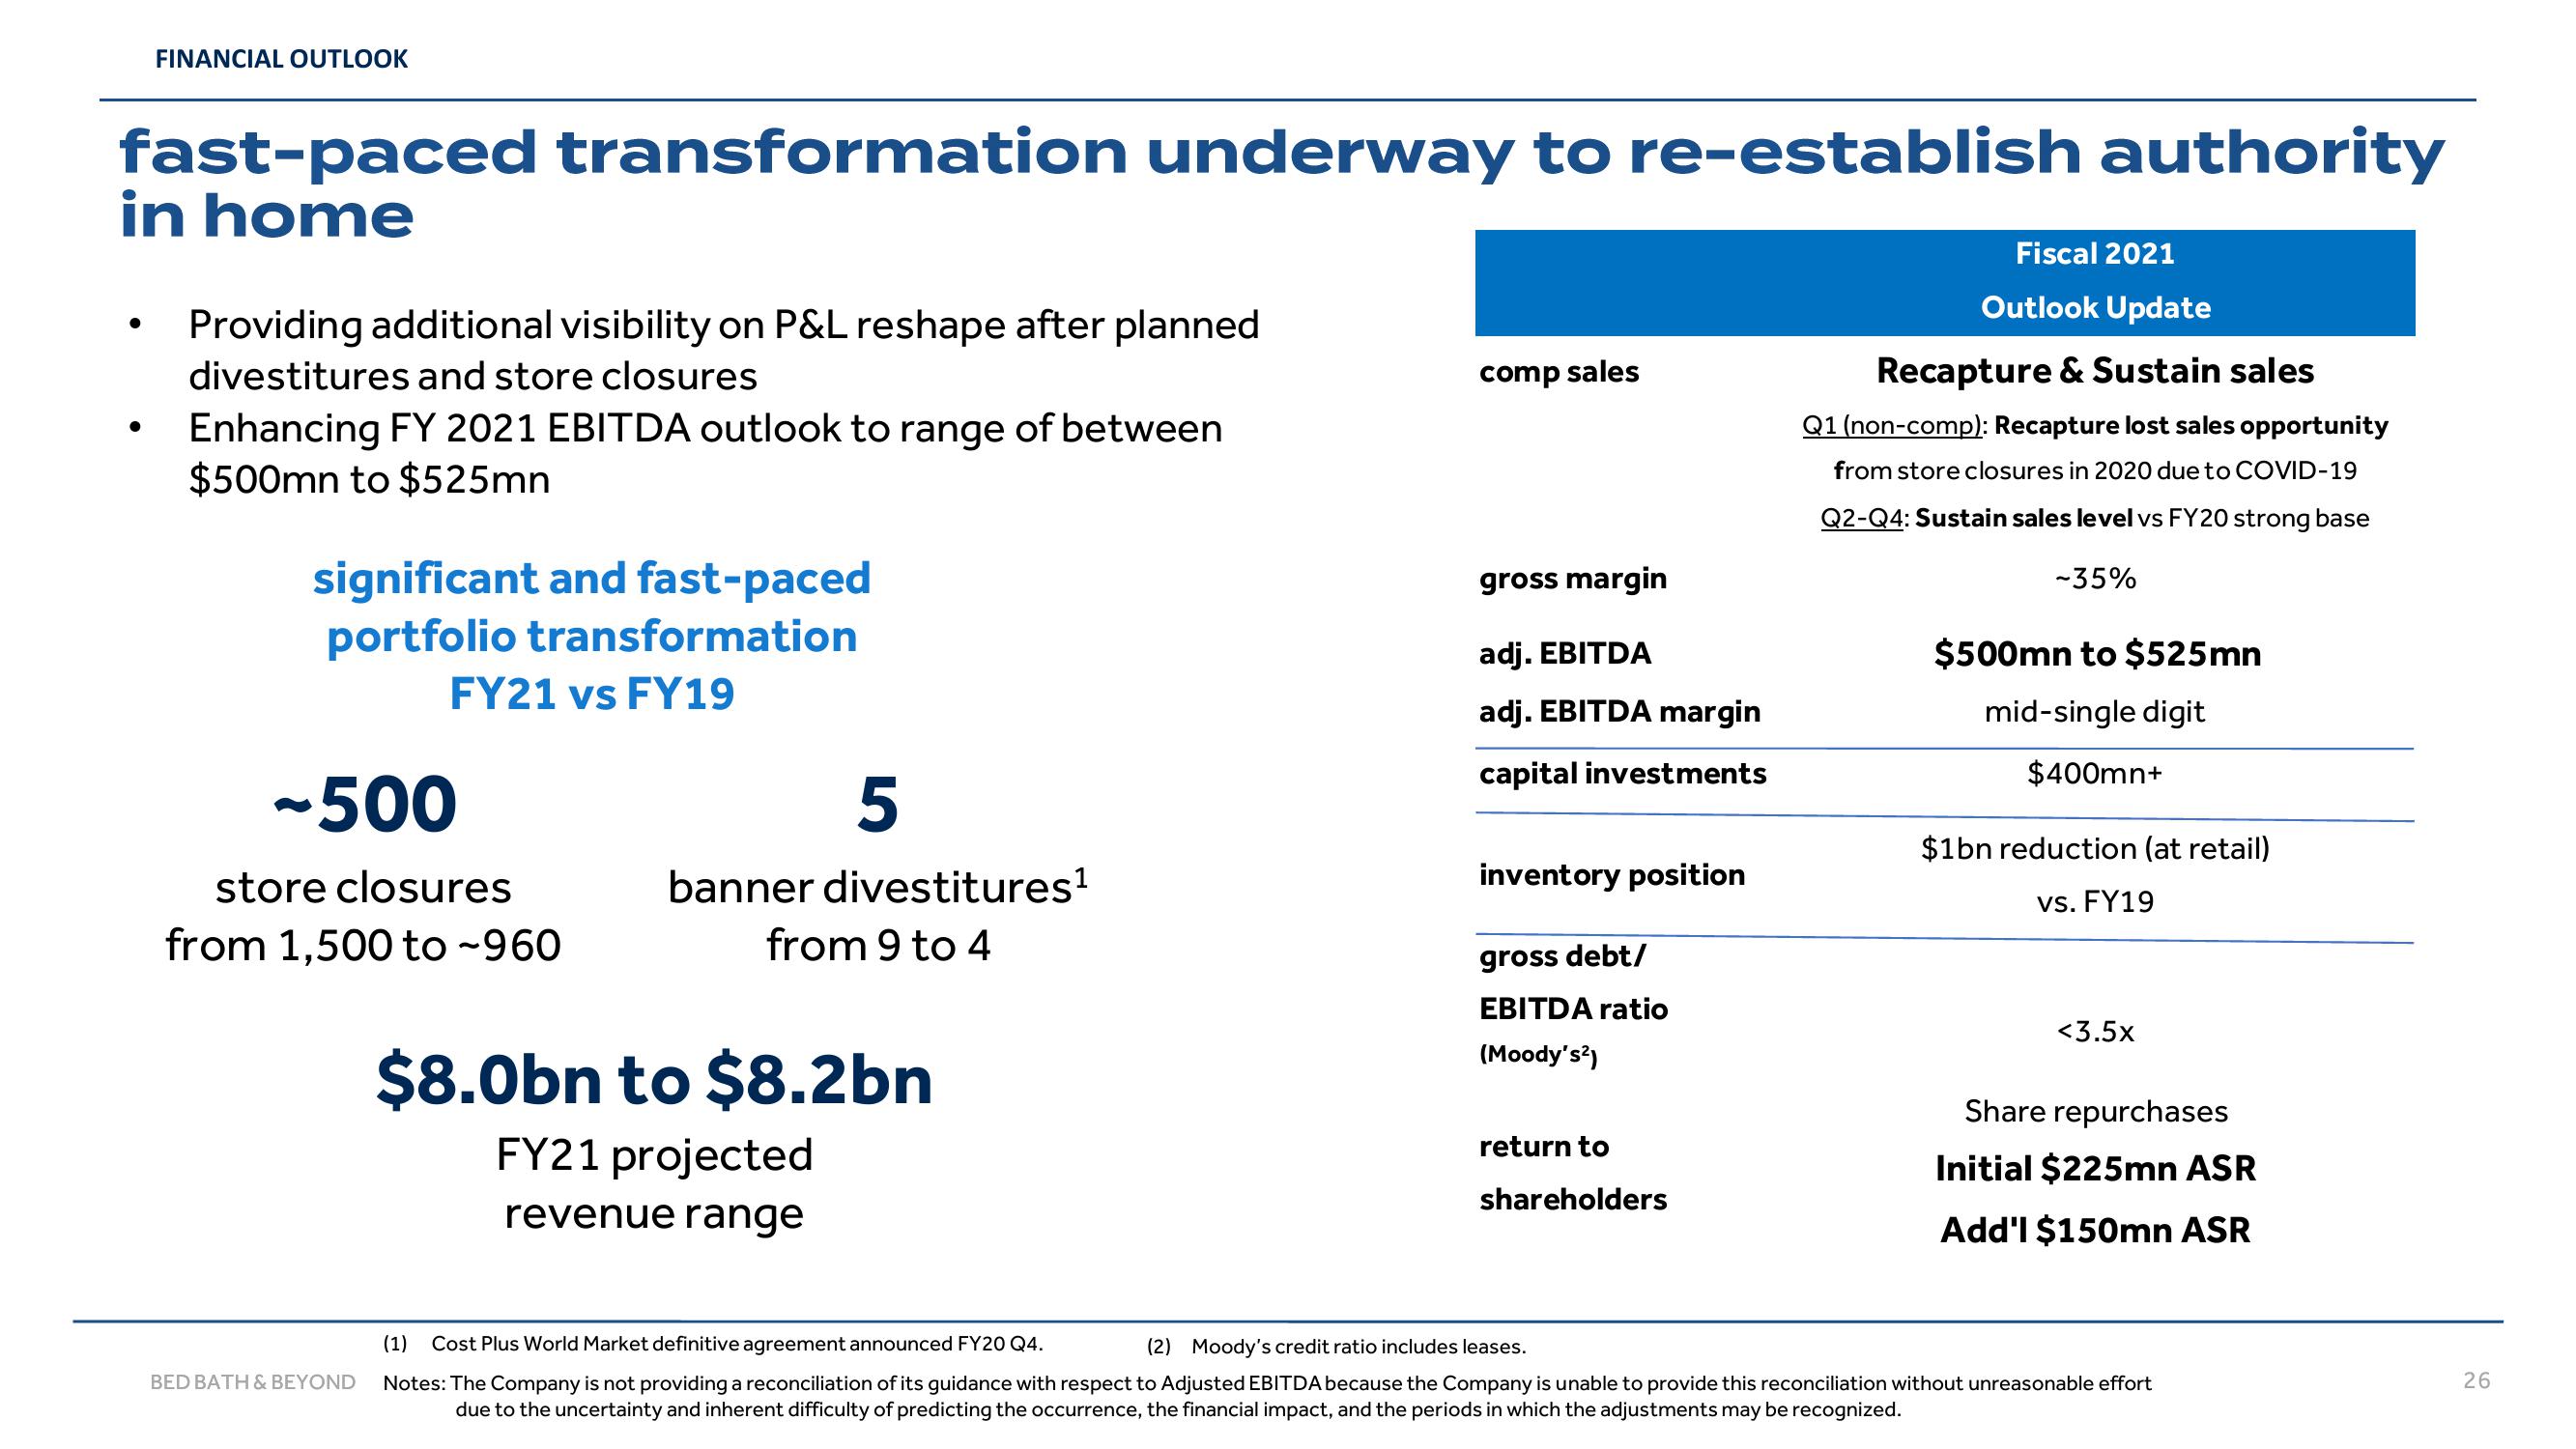
Providing additional visibility on P&L reshape after planned
divestitures and store closures
Enhancing FY 2021 EBITDA outlook to range of between
$500mn to $525mn
significant and fast-paced
portfolio transformation
FY21 vs FY19
-500
store closures
from 1,500 to -960
BED BATH & BEYOND
5
banner divestitures¹
from 9 to 4
$8.0bn to $8.2bn
FY21 projected
revenue range
comp sales
gross margin
adj. EBITDA
adj. EBITDA margin
capital investments
inventory position
gross debt/
EBITDA ratio
(Moody's²)
return to
shareholders
Fiscal 2021
Outlook Update
Recapture & Sustain sales
Q1 (non-comp): Recapture lost sales opportunity
from store closures in 2020 due to COVID-19
Q2-Q4: Sustain sales level vs FY20 strong base
-35%
$500mn to $525mn
mid-single digit
$400mn+
$1bn reduction (at retail)
vs. FY19
<3.5x
Share repurchases
Initial $225mn ASR
Add'l $150mn ASR
(2) Moody's credit ratio includes leases.
(1) Cost Plus World Market definitive agreement announced FY20 Q4.
Notes: The Company is not providing a reconciliation of its guidance with respect to Adjusted EBITDA because the Company is unable to provide this reconciliation without unreasonable effort
due to the uncertainty and inherent difficulty of predicting the occurrence, the financial impact, and the periods in which the adjustments may be recognized.
26View entire presentation