Sportradar IPO Presentation Deck
1
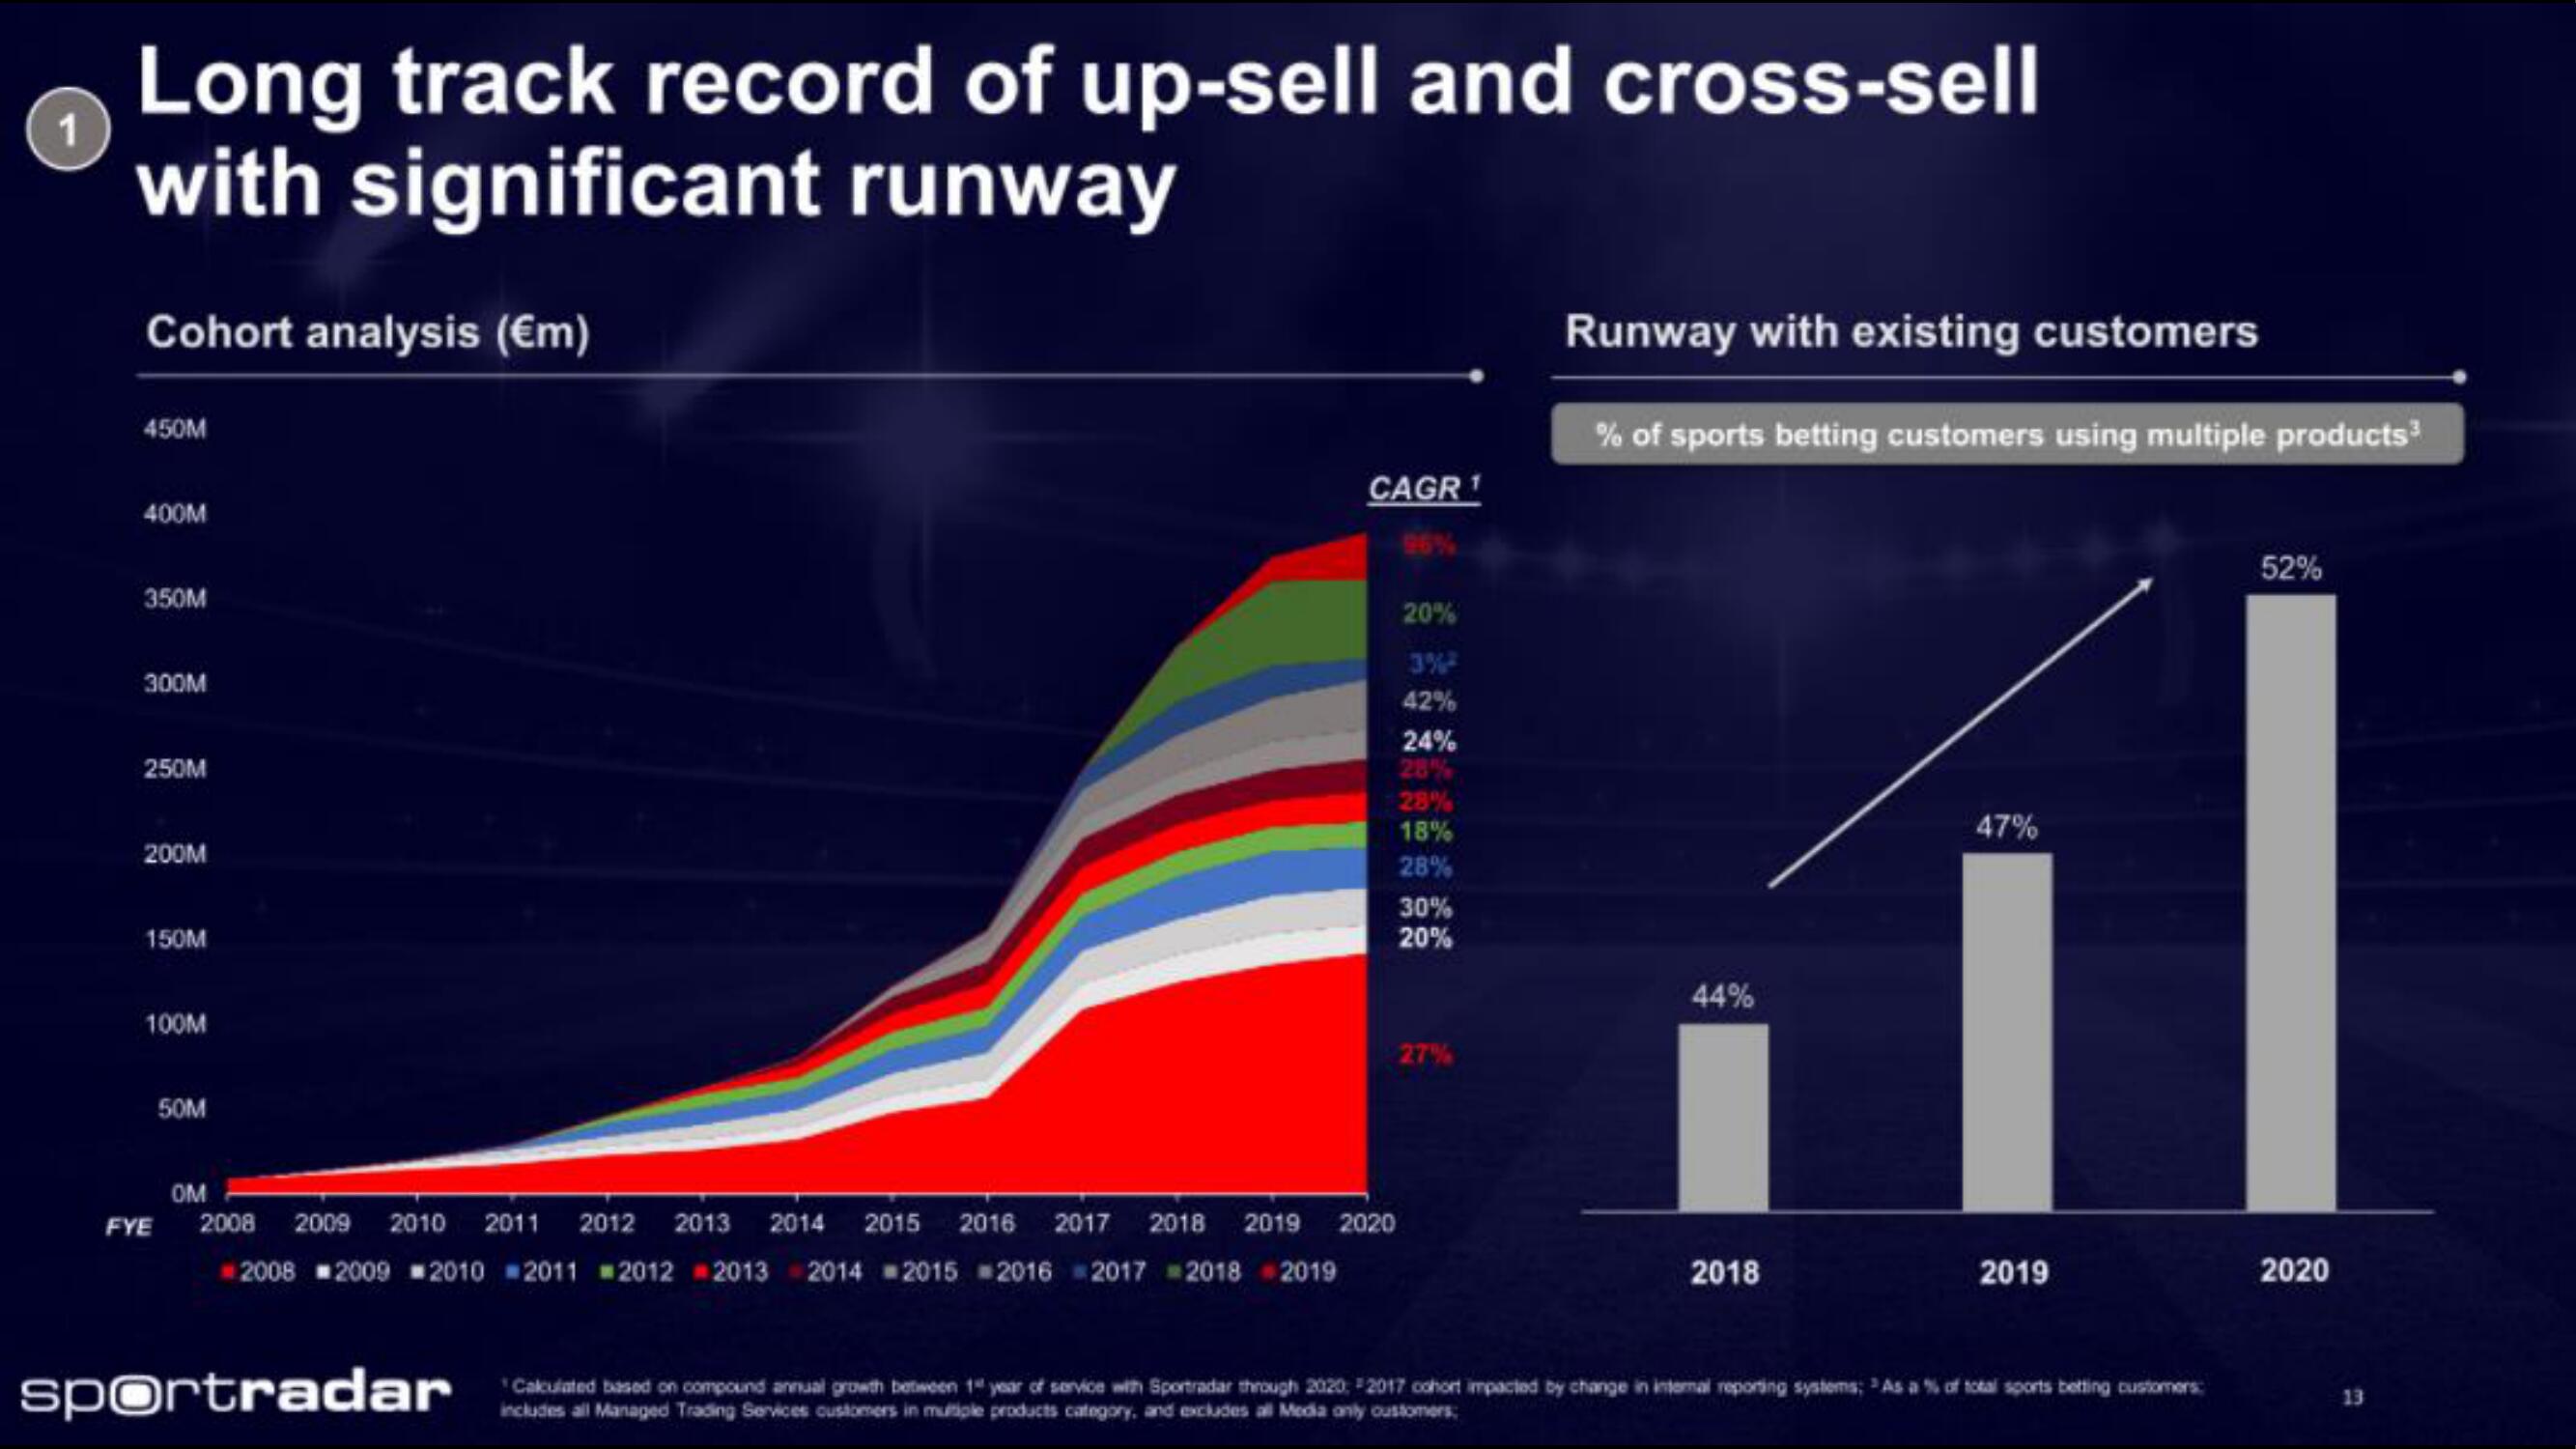
Long track record of up-sell and cross-sell
with significant runway
Cohort analysis (€m)
450M
400M
350M
300M
250M
200M
150M
100M
50M
CAGR 1
20%
42%
24%
28%
28%
18%
28%
30%
20%
27%
OM
FYE 2008 2009 2010 2011 2012 2013 2014 2015 2016 2017 2018 2019 2020
2008 2009 2010 2011 2012 2013 2014 2015 2016 2017 2018 2019
Runway with existing customers
% of sports betting customers using multiple products³
44%
2018
47%
2019
sportradar akulated on compound aremal between 1 of service wth Sportadar through 2020, 2017 cohort impacted by change in intreal reporting systems. As a % of tota sports beting customers
includes all Managed Trading Services customers in multiple products category, and excludes all Media only customers;
52%
2020
13View entire presentation