Marti Results Presentation Deck
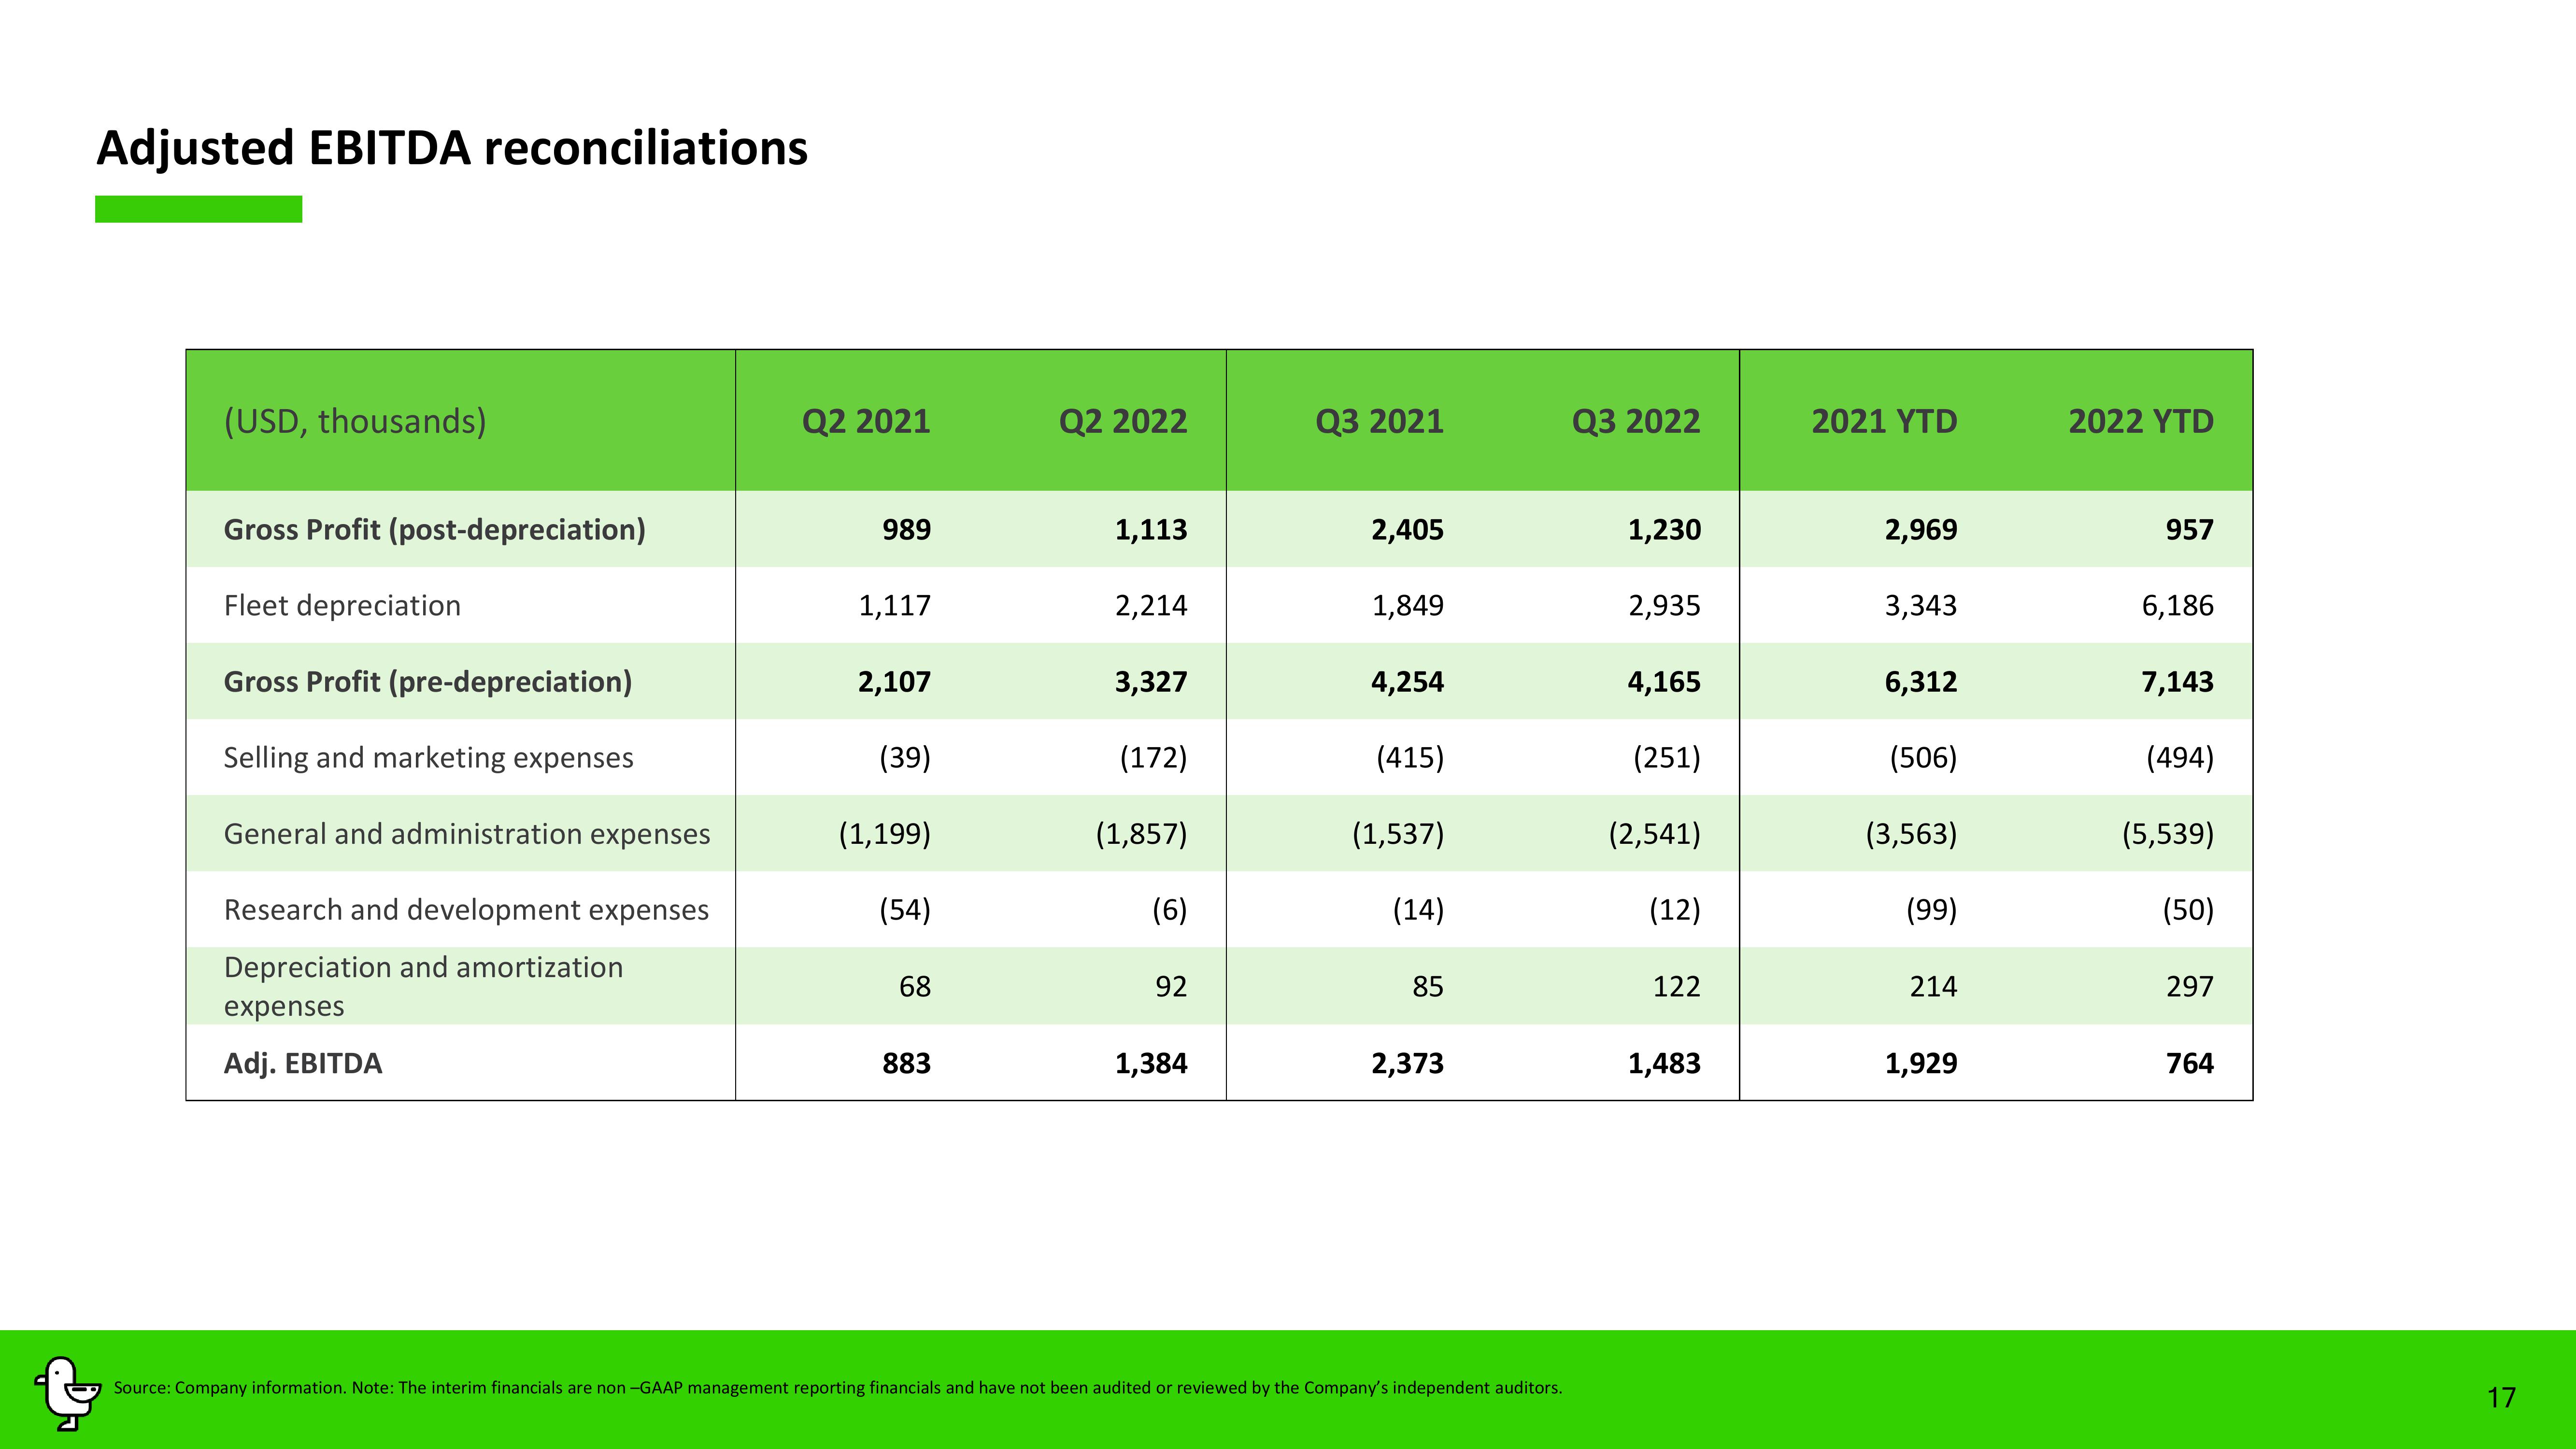
Adjusted EBITDA reconciliations
(USD, thousands)
Gross Profit (post-depreciation)
Fleet depreciation
Gross Profit (pre-depreciation)
Selling and marketing expenses
General and administration expenses
Research and development expenses
Depreciation and amortization
expenses
Adj. EBITDA
Q2 2021
989
1,117
2,107
(39)
(1,199)
(54)
68
883
Q2 2022
1,113
2,214
3,327
(172)
(1,857)
(6)
92
1,384
Q3 2021
2,405
1,849
4,254
(415)
(1,537)
(14)
85
2,373
Source: Company information. Note: The interim financials are non-GAAP management reporting financials and have not been audited or reviewed by the Company's independent auditors.
Q3 2022
1,230
2,935
4,165
(251)
(2,541)
(12)
122
1,483
2021 YTD
2,969
3,343
6,312
(506)
(3,563)
(99)
214
1,929
2022 YTD
957
6,186
7,143
(494)
(5,539)
(50)
297
764
17View entire presentation