Moelis & Company Investment Banking Pitch Book
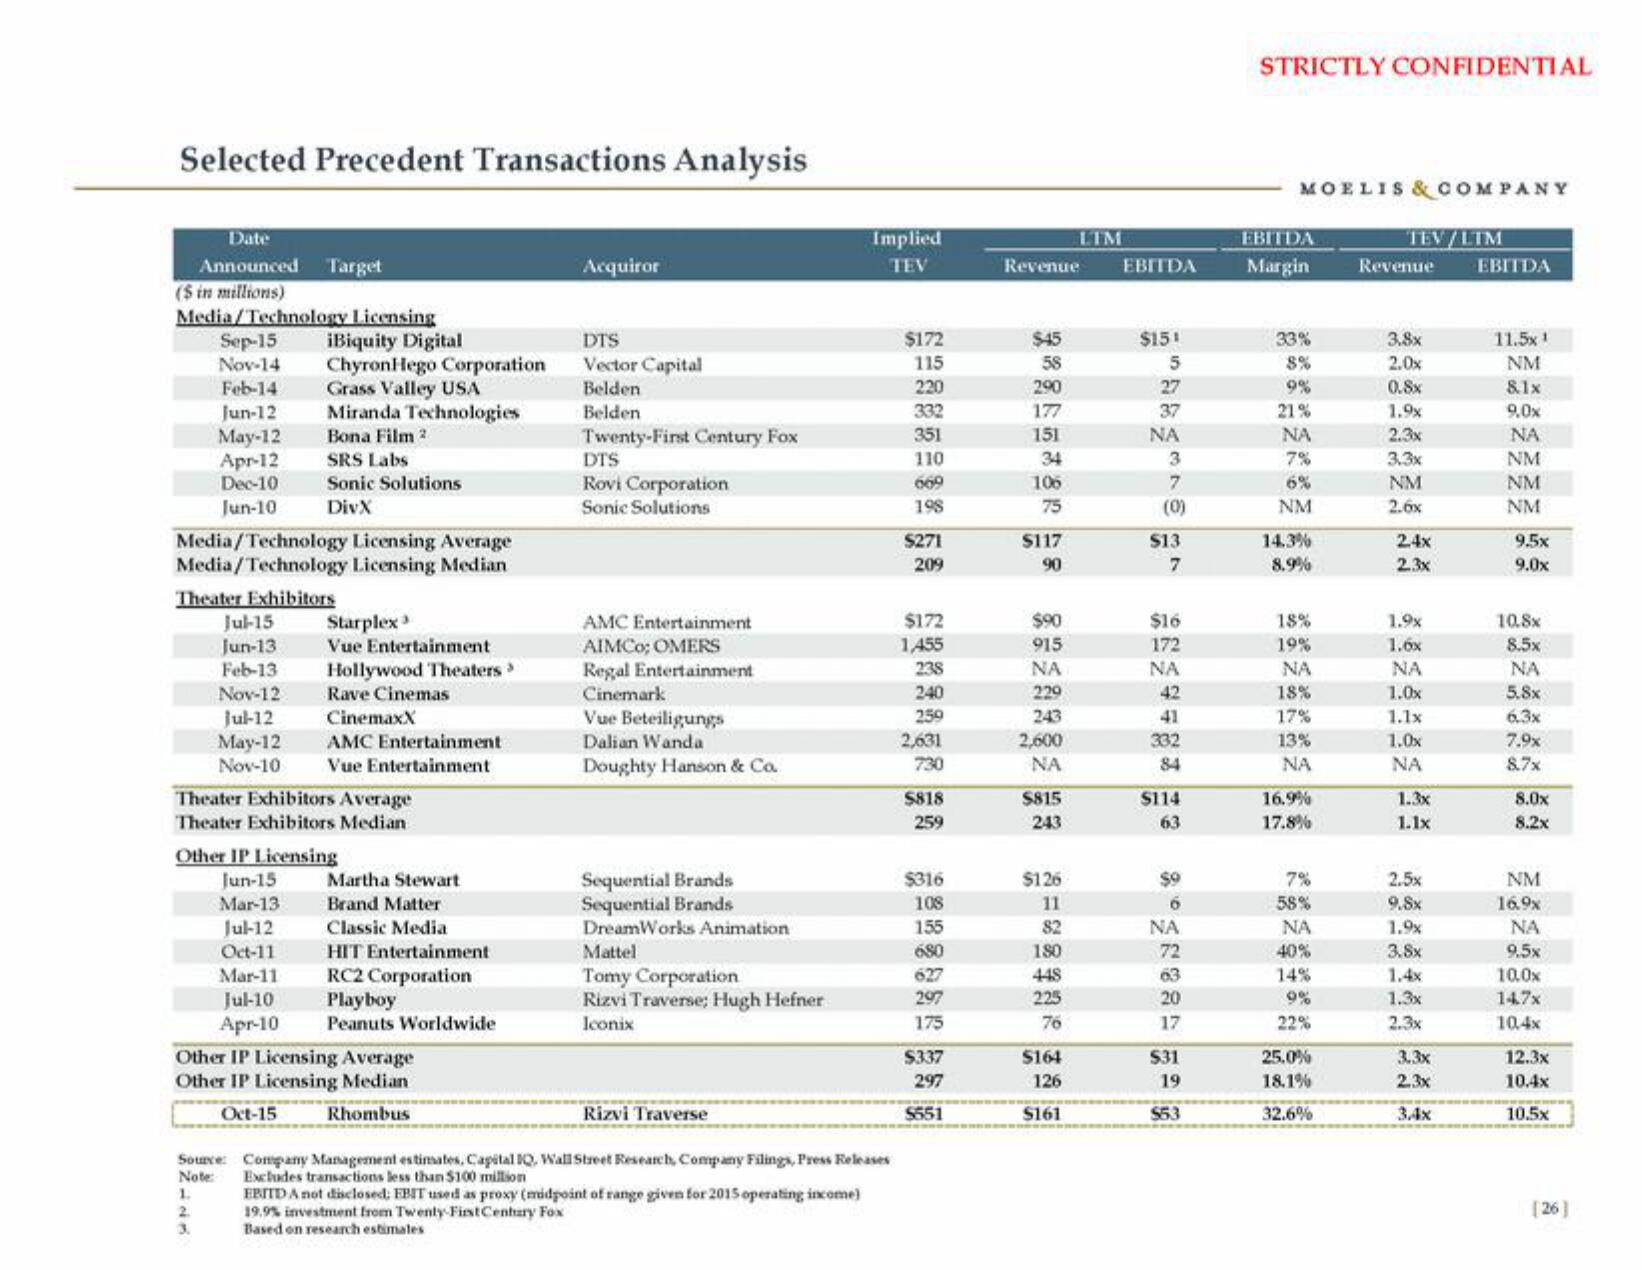
Selected Precedent Transactions Analysis
Date
Announced Target
($ in millions)
Media/Technology Licensing
Sep-15
Nov-14
Feb-14
Jun-12
May-12
Apr-12
Dec-10
Jun-10
Jul-15
Jun-13
Feb-13
Media/Technology Licensing Average
Media/Technology Licensing Median
Theater Exhibitors
Nov-12
Jul-12
May-12
Nov-10
1.
2.
iBiquity Digital
ChyronHego Corporation
Grass Valley USA
Miranda Technologies
Bona Film 2.
SRS Labs
Sonic Solutions
DivX
Jul-12
Oct-11
Mar-11
Jul-10
Apr-10
Theater Exhibitors Average
Theater Exhibitors Median
Starplex
Vue Entertainment
Hollywood Theaters >
Rave Cinemas
CinemaxX
AMC Entertainment
Vue Entertainment
Other IP Licensing
Jun-15
Mar-13
Martha Stewart
Brand Matter
Classic Media
HIT Entertainment
RC2 Corporation
Playboy
Peanuts Worldwide
Other IP Licensing Average
Other IP Licensing Median
Oct-15
Rhombus
Acquiror
DTS
Vector Capital
Belden
Belden
Twenty-First Century Fox
DTS
Rovi Corporation
Sonic Solutions
AMC Entertainment
AIMCO; OMERS
Regal Entertainment
Cinemark
Vue Beteiligungs
Dalian Wanda
Doughty Hanson & Co.
Sequential Brands
Sequential Brands
DreamWorks Animation
Mattel
Tomy Corporation
Rizvi Traverse: Hugh Hefner
Iconix
Rizvi Traverse
Source: Company Management estimates, Capital IQ, Wall Street Research, Company Filings, Press Releases
Note: Excludes transactions less than $100 million
Implied
TEV
EBITDA not disclosed; EBIT used as proxy (midpoint of range given for 2015 operating income)
19.9% investment from Twenty-First Century Fox
Based on research estimates
$172
115
220
332
351
110
669
198
$271
209
$172
1,455
238
240
259
2,631
730
$818
259
$316
108
155
680
627
297
175
$337
297
S551
Revenue
$45
58
290
177
151
34
106
75
$117
90
$90
915
ΝΑ
229
243
2,600
ΝΑ
$815
243
$126
11
82
180
448
225
76
LTM
$164
126
$161
EBITDA
$151
5
27
37
ΝΑ
3
7
(0)
$13
7
$16
172
ΝΑ
42
41
332
84
$114
63
$9
6
ΝΑ
72
63
20
17
$31
19
$53
STRICTLY CONFIDENTIAL
MOELIS & COMPANY
EBITDA
Margin
33%
8%
9%
21%
NA
7%
NM
14.3%
8.9%
18%
19%
NA
18%
17%
13%
ΝΑ
16.9%
17.8%
7%
58%
ΝΑ
40%
14%
22%
25.0%
18.1%
32.6%
TEV/LTM
Revenue
3.8x
2.0x
0.8x
1.9x
2.3x
3.3x
NM
2.6x
2.4x
2.3x
1.9x
1.6x
ΝΑ
1.0x
1.1x
1.0x
NA
1.3x
1.1x
2.5x
9.8x
1.9x
3.8x
1.4x
1.3x
2.3x
3.3x
2.3x
EBITDA
11.5x1
NM
&1x
9.0x
ΝΑ
NM
NM
NM
9.5x
9.0x
10.8x
8.5x
NA
5.8x
6.3x
7.9x
8.7x
8.0x
8.2x
NM
16.9x
NA
9.5x
10.0x
147x
10,4x
12.3x
10.4x
105×
[26]View entire presentation