Apollo Global Management Investor Day Presentation Deck
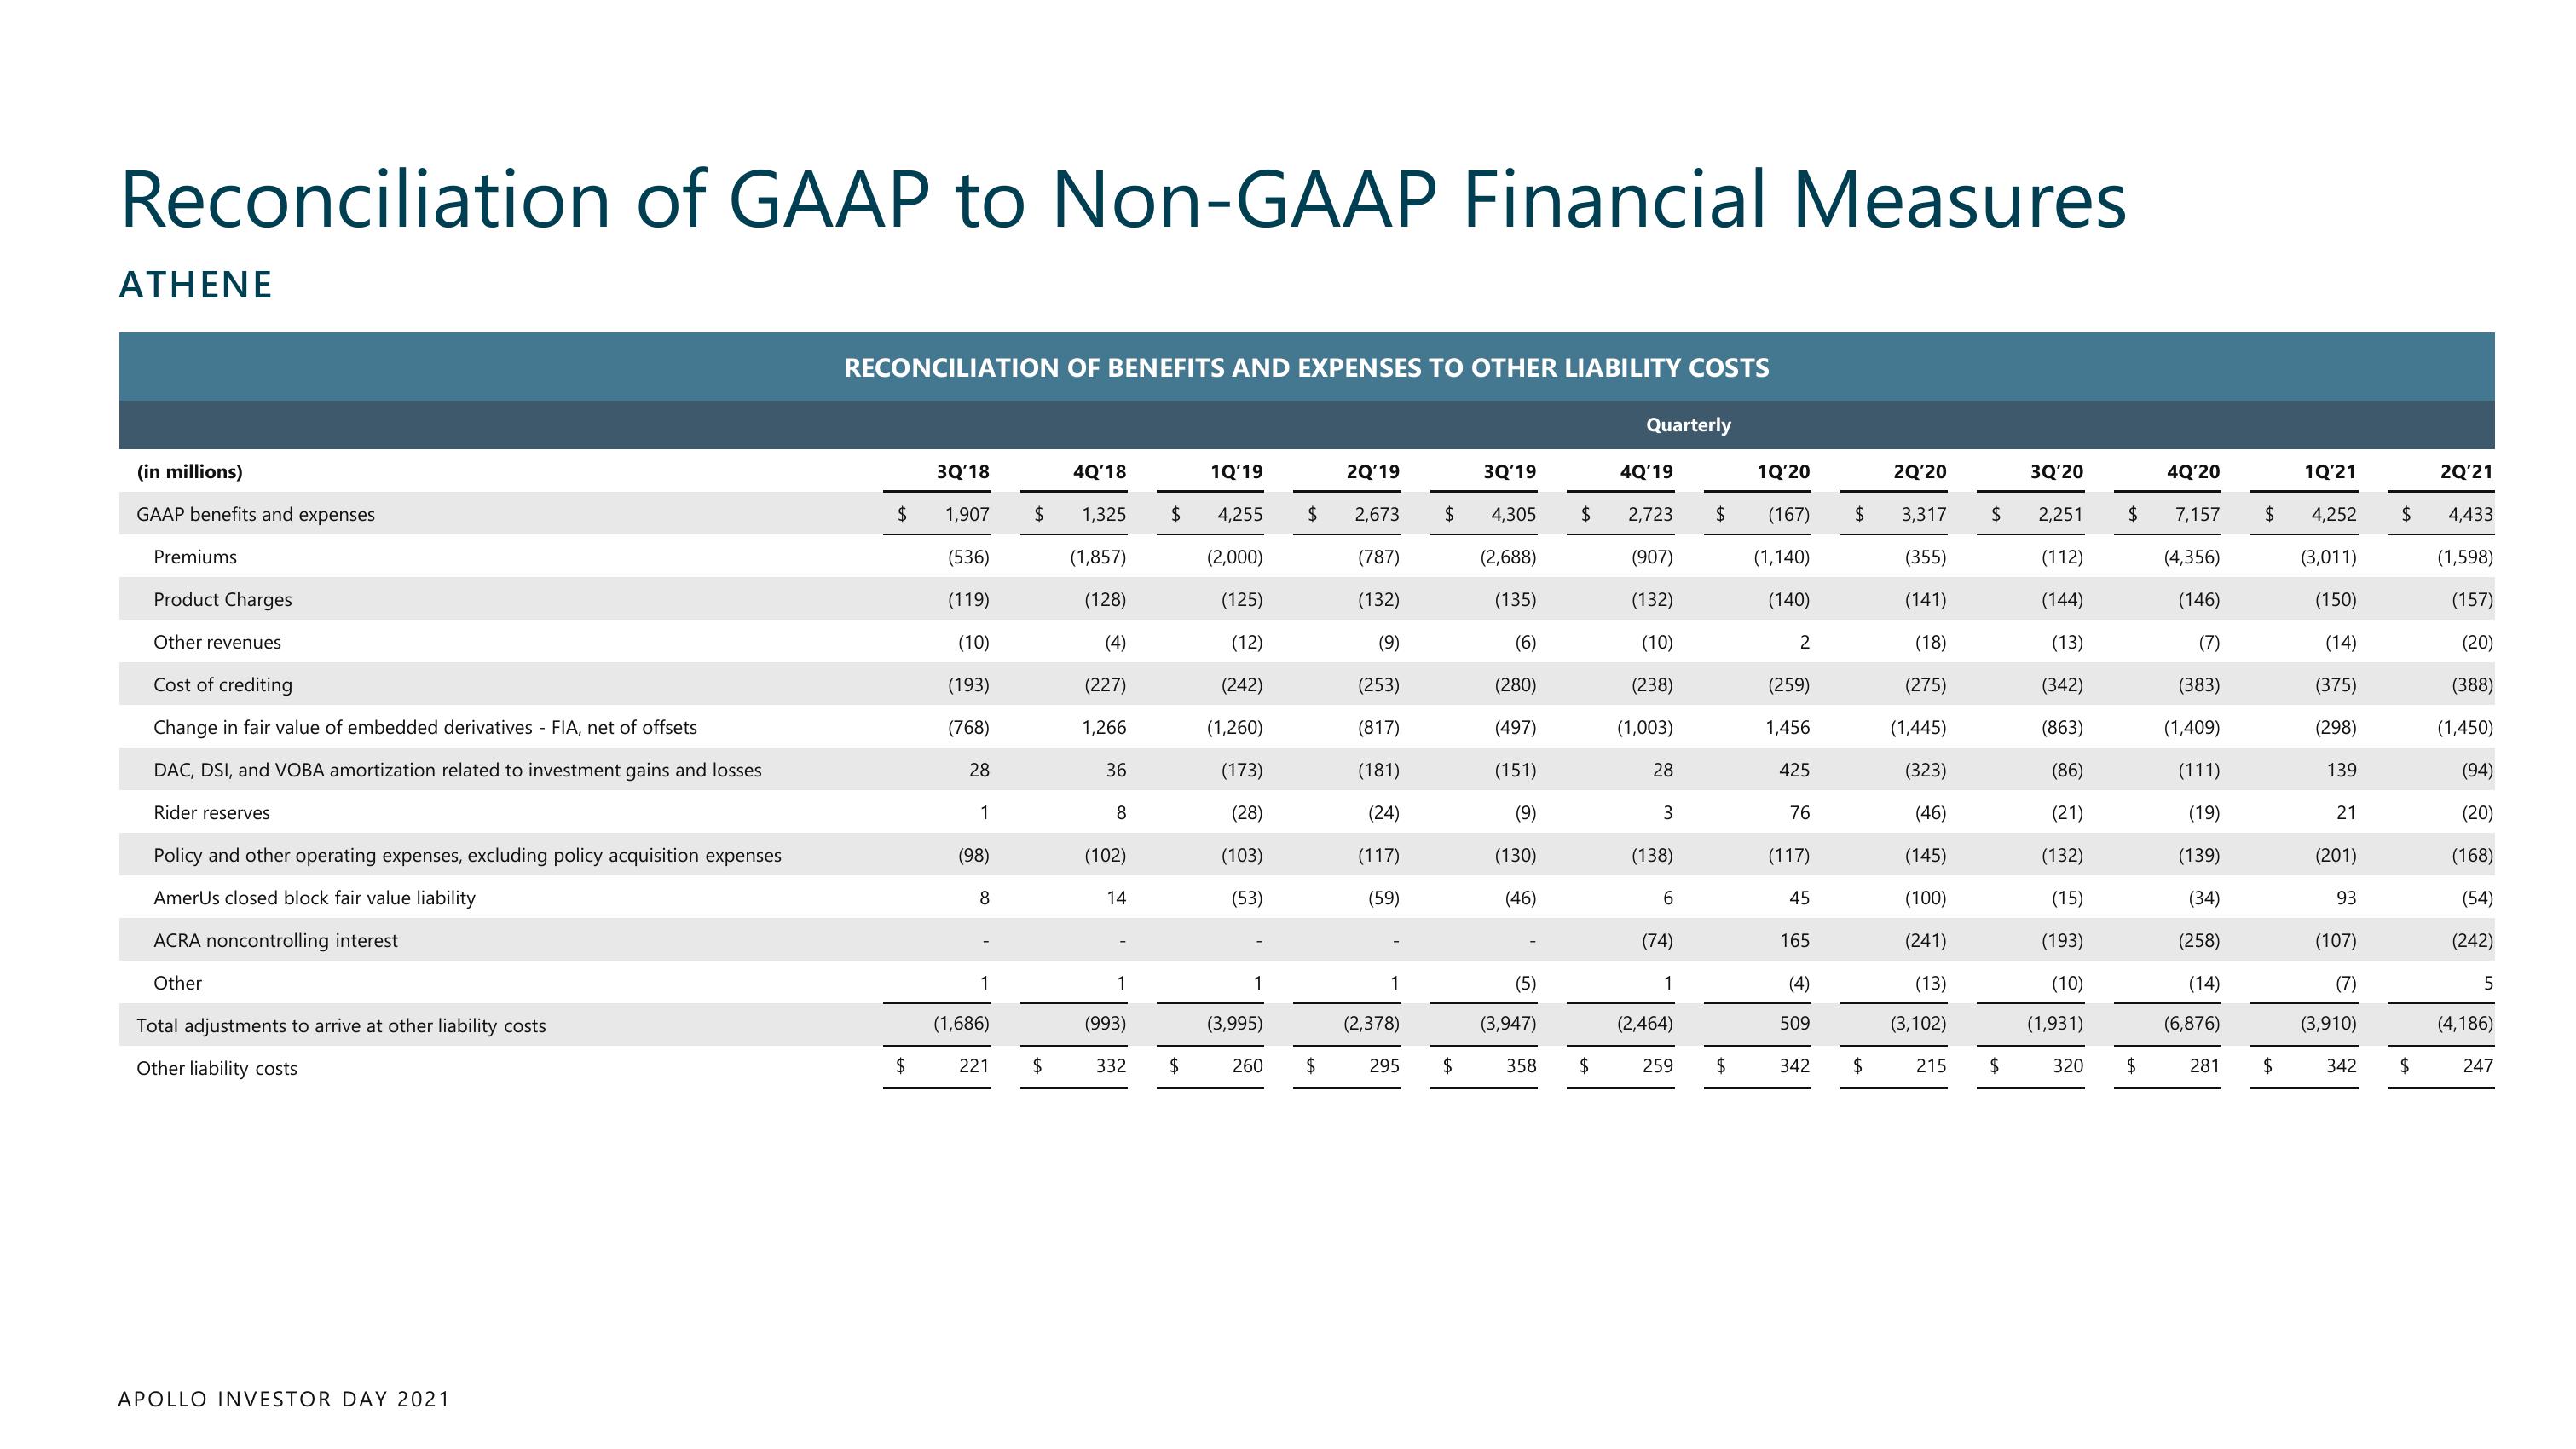
Reconciliation of GAAP to Non-GAAP Financial Measures
ATHENE
(in millions)
GAAP benefits and expenses
Premiums
Product Charges
Other revenues
Cost of crediting
Change in fair value of embedded derivatives - FIA, net of offsets
DAC, DSI, and VOBA amortization related to investment gains and losses
Rider reserves
Policy and other operating expenses, excluding policy acquisition expenses
AmerUs closed block fair value liability
ACRA noncontrolling interest
Other
Total adjustments to arrive at other liability costs
Other liability costs
APOLLO INVESTOR DAY 2021
RECONCILIATION OF BENEFITS AND EXPENSES TO OTHER LIABILITY COSTS
$
$
3Q'18
1,907 $
(536)
(119)
(10)
(193)
(768)
28
1
(98)
8
1
(1,686)
221
$
4Q'18
1,325
(1,857)
(128)
(4)
(227)
1,266
36
8
(102)
14
1
(993)
332
$
$
1Q'19
4,255
(2,000)
(125)
(12)
(242)
(1,260)
(173)
(28)
(103)
(53)
1
(3,995)
$
260 $
2Q'19
2,673 $
(787)
(132)
(9)
(253)
(817)
(181)
(24)
(117)
(59)
(2,378)
295 $
3Q'19
4,305
(2,688)
(135)
(6)
(280)
(497)
(151)
(9)
(130)
(46)
(5)
(3,947)
$
358 $
Quarterly
4Q'19
2,723
(907)
(132)
(10)
(238)
(1,003)
28
3
(138)
6
(74)
1
(2,464)
259
$
$
1Q'20
(167)
(1,140)
(140)
2
(259)
1,456
425
76
(117)
45
165
(4)
509
342
2Q'20
$ 3,317
(355)
(141)
(18)
(275)
(1,445)
(323)
(46)
(145)
(100)
(241)
(13)
(3,102)
$
$
215 $
3Q'20
2,251
(112)
(144)
(13)
(342)
(863)
(86)
(21)
(132)
(15)
(193)
(10)
(1,931)
$
320 $
4Q'20
7,157
(4,356)
(146)
(7)
(383)
(1,409)
(111)
(19)
(139)
(34)
(258)
(14)
(6,876)
281
1Q'21
$ 4,252
(3,011)
(150)
(14)
(375)
(298)
139
$
21
(201)
93
(107)
(7)
(3,910)
342
$
$
2Q'21
4,433
(1,598)
(157)
(20)
(388)
(1,450)
(94)
(20)
(168)
(54)
(242)
5
(4,186)
247View entire presentation