JD Sports Results Presentation Deck
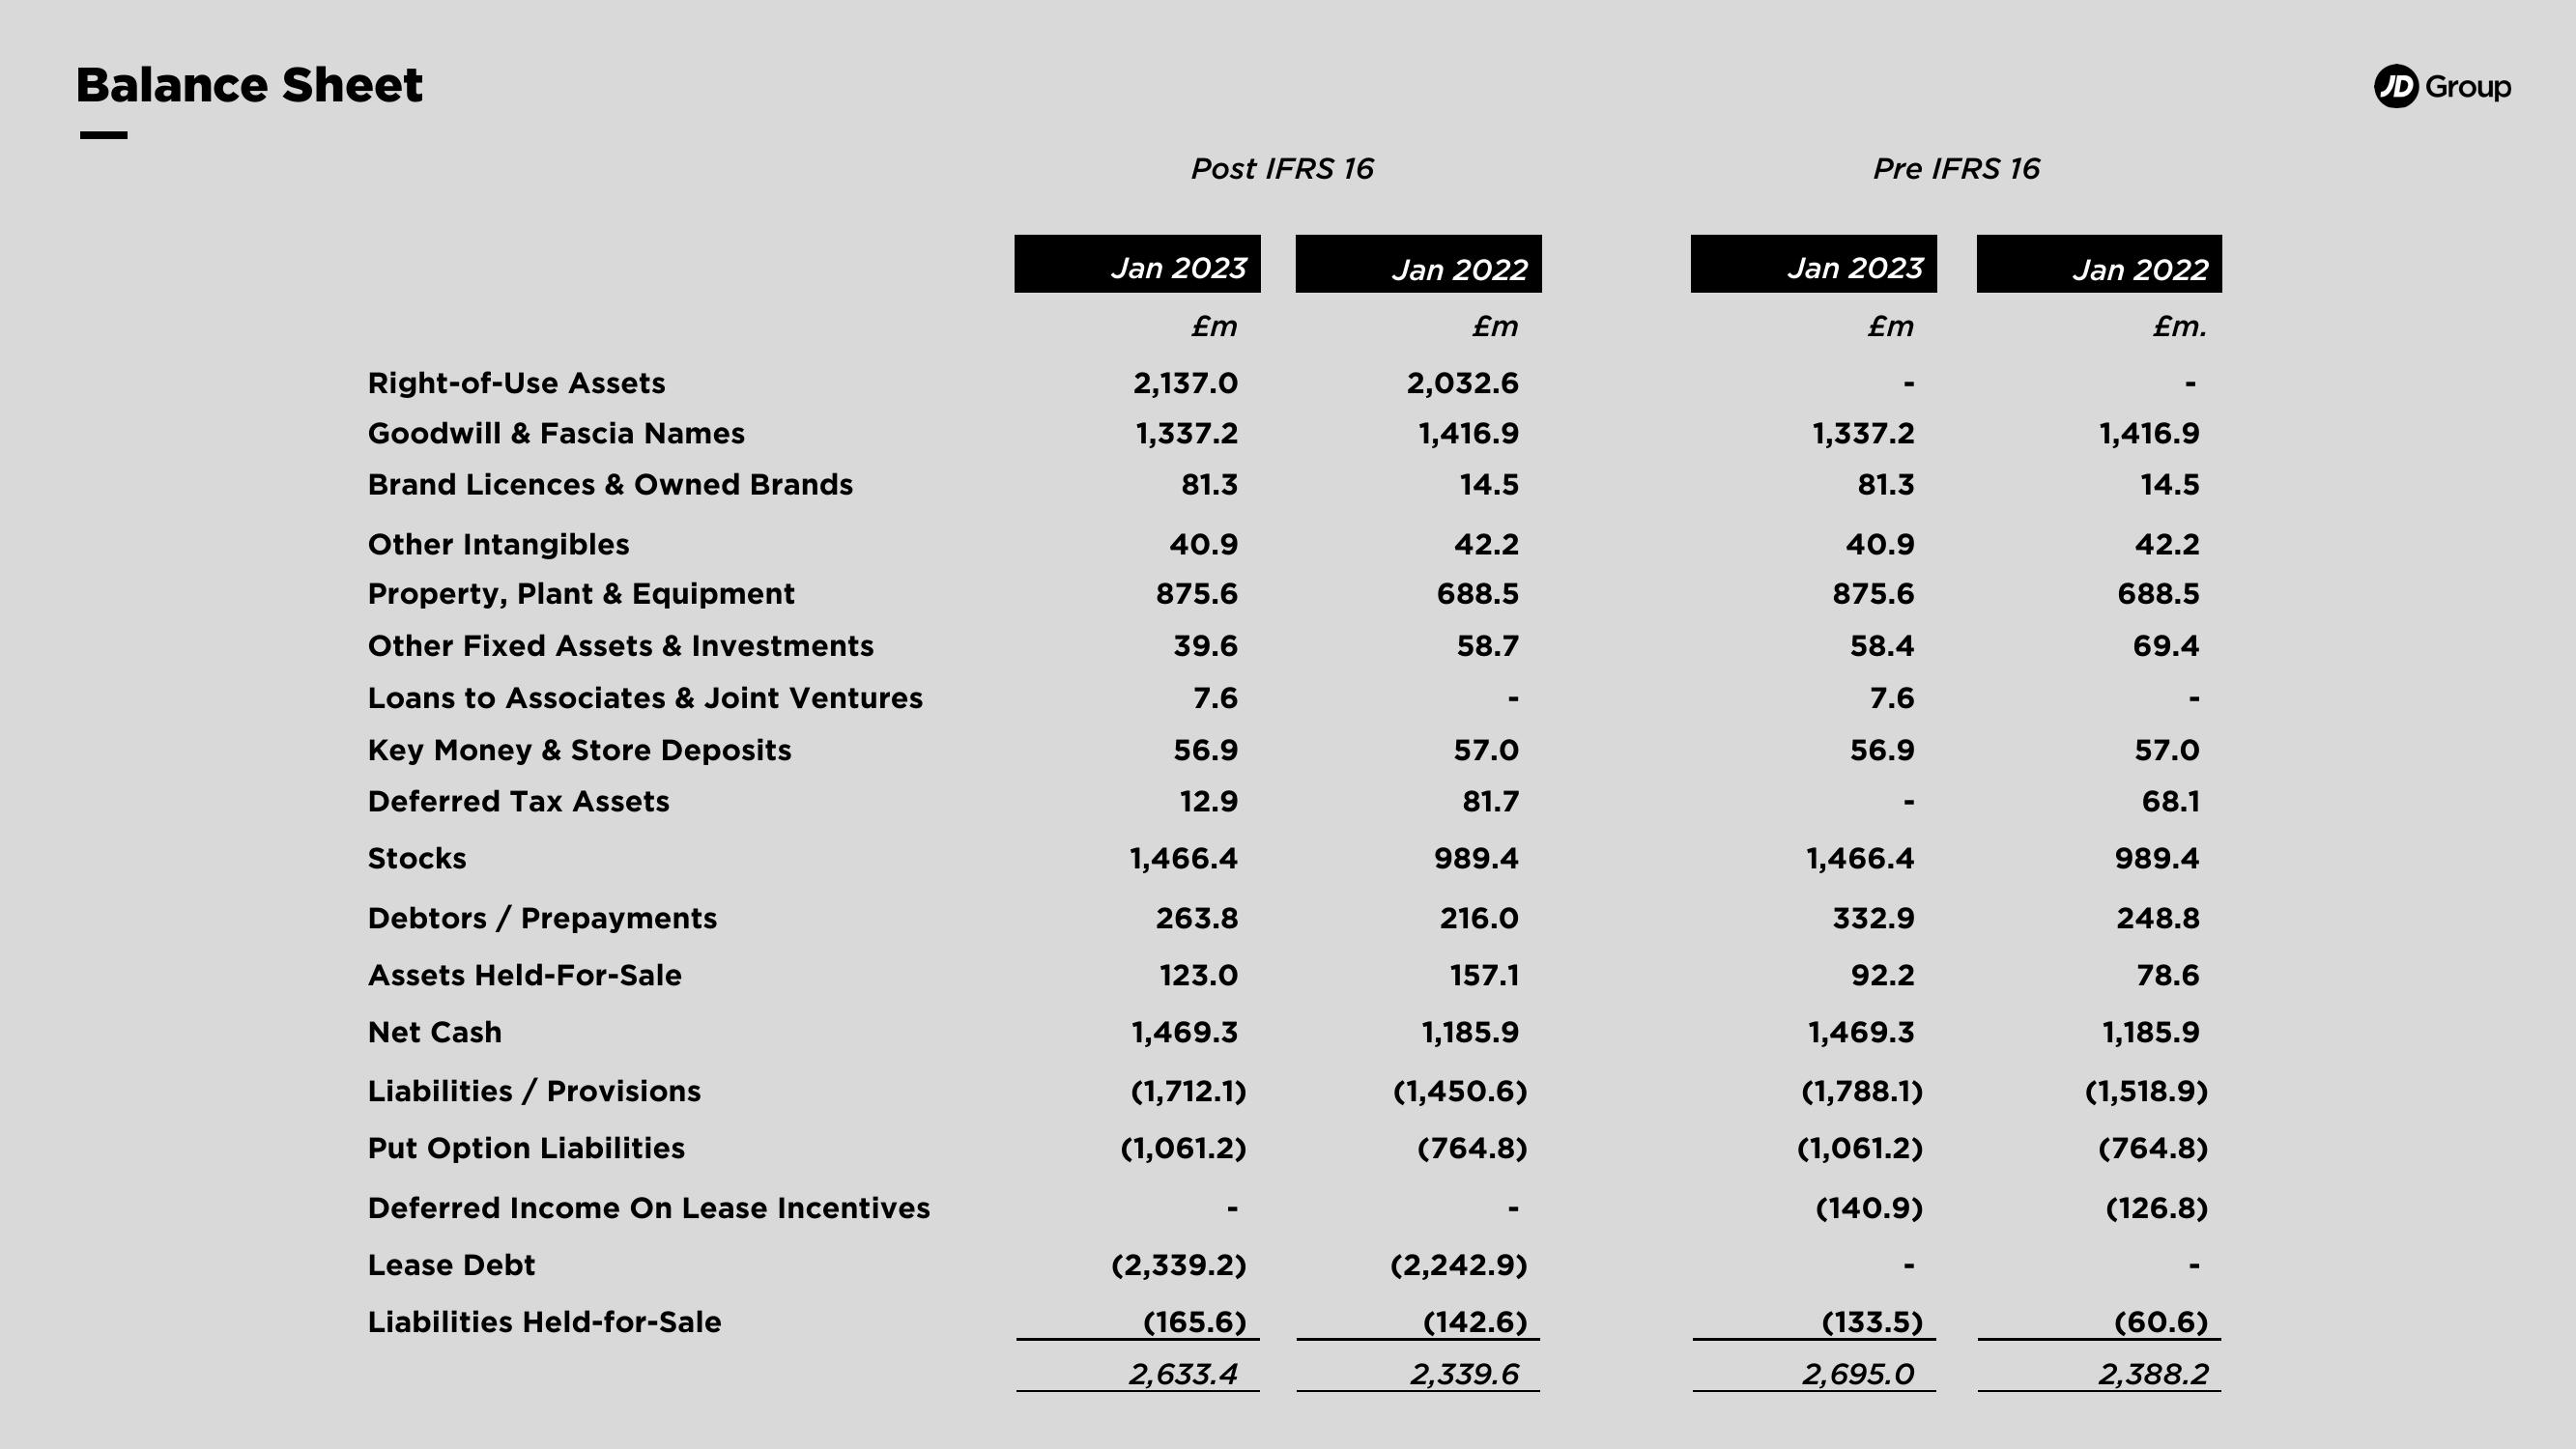
Balance Sheet
Right-of-Use Assets
Goodwill & Fascia Names
Brand Licences & Owned Brands
Other Intangibles
Property, Plant & Equipment
Other Fixed Assets & Investments
Loans to Associates & Joint Ventures
Key Money & Store Deposits
Deferred Tax Assets
Stocks
Debtors / Prepayments
Assets Held-For-Sale
Net Cash
Liabilities/Provisions
Put Option Liabilities
Deferred Income On Lease Incentives
Lease Debt
Liabilities Held-for-Sale
Post IFRS 16
Jan 2023
£m
2,137.0
1,337.2
81.3
40.9
875.6
39.6
7.6
56.9
12.9
1,466.4
263.8
123.0
1,469.3
(1,712.1)
(1,061.2)
(2,339.2)
(165.6)
2,633.4
Jan 2022
£m
2,032.6
1,416.9
14.5
42.2
688.5
58.7
57.0
81.7
989.4
216.0
157.1
1,185.9
(1,450.6)
(764.8)
(2,242.9)
(142.6)
2,339.6
Pre IFRS 16
Jan 2023
£m
1,337.2
81.3
40.9
875.6
58.4
7.6
56.9
1,466.4
332.9
92.2
1,469.3
(1,788.1)
(1,061.2)
(140.9)
(133.5)
2,695.0
Jan 2022
£m.
1,416.9
14.5
42.2
688.5
69.4
57.0
68.1
989.4
248.8
78.6
1,185.9
(1,518.9)
(764.8)
(126.8)
(60.6)
2,388.2
JD GroupView entire presentation