KLA Investor Day Presentation Deck
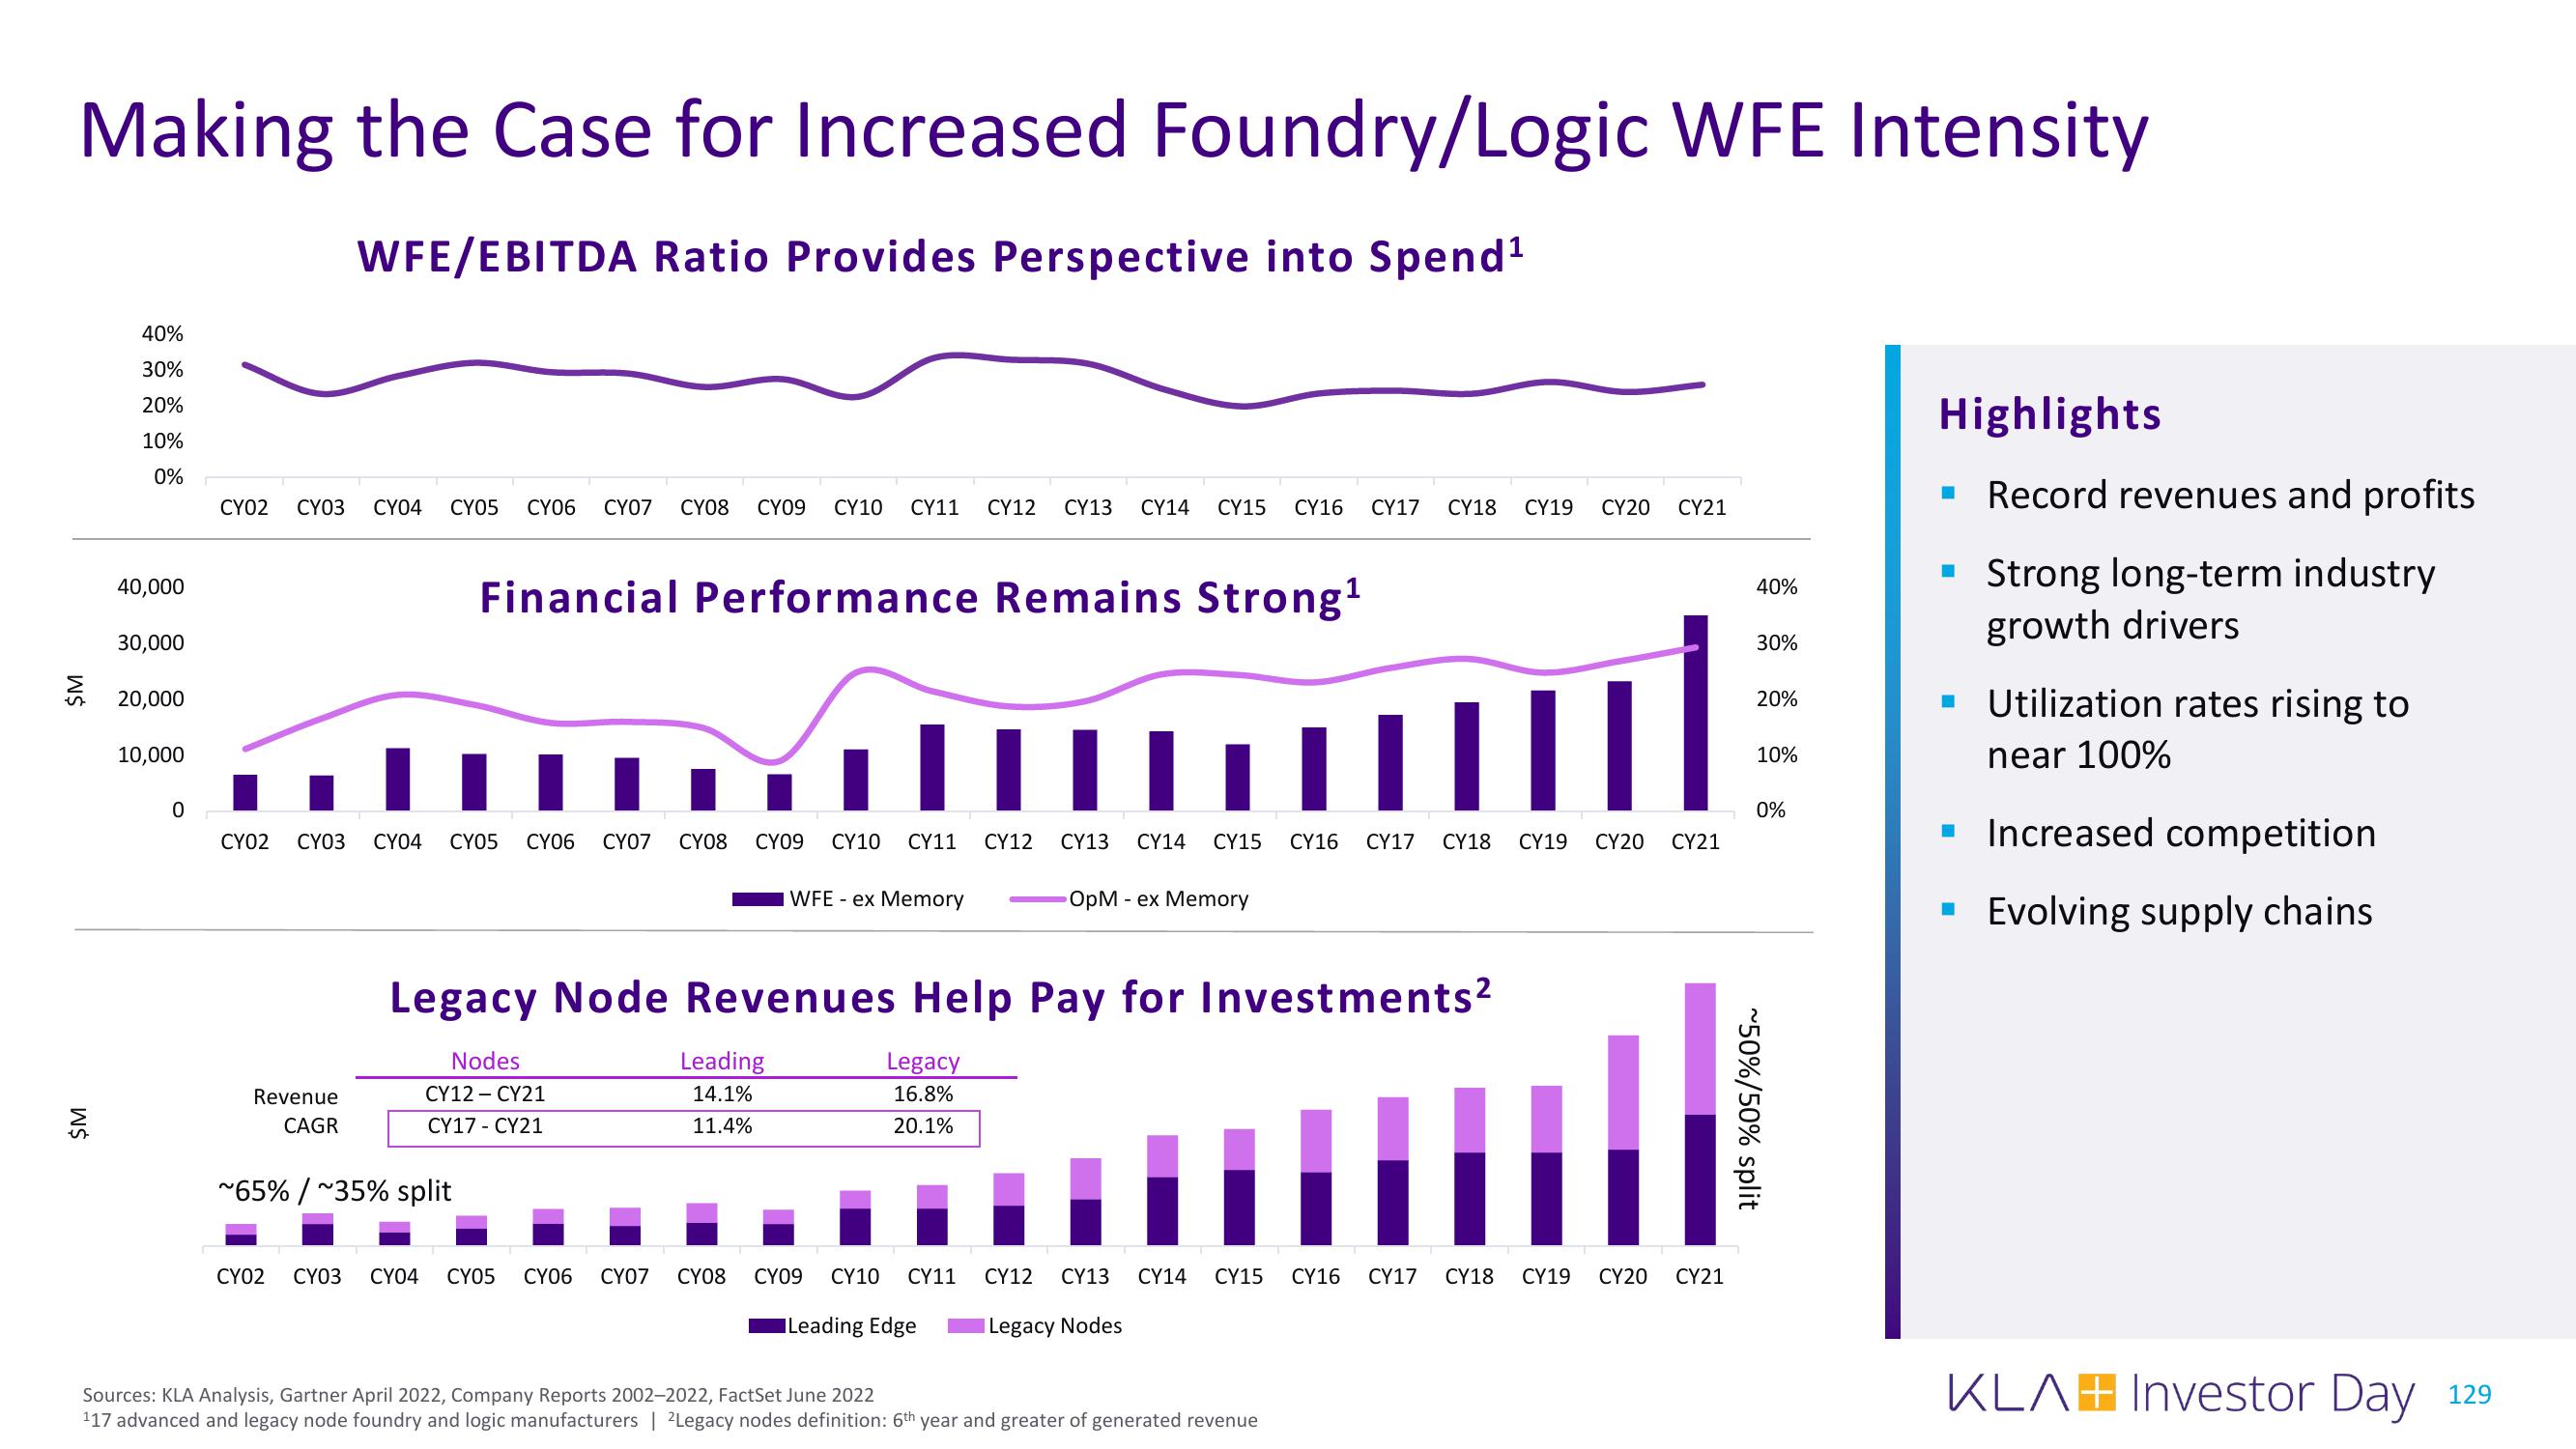
Making the Case for Increased Foundry/Logic WFE Intensity
WFE/EBITDA Ratio Provides Perspective into Spend¹
ŞM
$M
40%
30%
20%
10%
0%
40,000
30,000
20,000
10,000
0
CY02 CY03 CY04 CY05 CY06 CY07 CY08 CY09 CY10 CY11 CY12 CY13 CY14 CY15 CY16 CY17 CY18 CY19 CY20 CY21
Financial Performance Remains Strong¹
..…………….…………….……………
CY02 CY03 CY04 CY05
Revenue
CAGR
||||
CY06 CY07 CY08 CY09 CY10 CY11 CY12 CY13 CY14 CY15 CY16 CY17 CY18 CY19 CY20 CY21
~65% /~35% split
Nodes
CY12 - CY21
CY17- CY21
Legacy Node Revenues Help Pay for Investments²
Leading
14.1%
11.4%
WFE - ex Memory
CY02 CY03 CY04 CY05 CY06 CY07 CY08
Legacy
16.8%
20.1%
CY09 CY10 CY11
OpM - ex Memory
Leading Edge
CY12 CY13 CY14 CY15
Legacy Nodes
Sources: KLA Analysis, Gartner April 2022, Company Reports 2002-2022, FactSet June 2022
117 advanced and legacy node foundry and logic manufacturers | 2Legacy nodes definition: 6th year and greater of generated revenue
CY16 CY17 CY18 CY19 CY20 CY21
40%
30%
20%
10%
0%
~50%/50% split
Highlights
Record revenues and profits
Strong long-term industry
growth drivers
■
Utilization rates rising to
near 100%
▪ Increased competition
▪ Evolving supply chains
KLAH Investor Day
129View entire presentation