Apollo Global Management Investor Day Presentation Deck
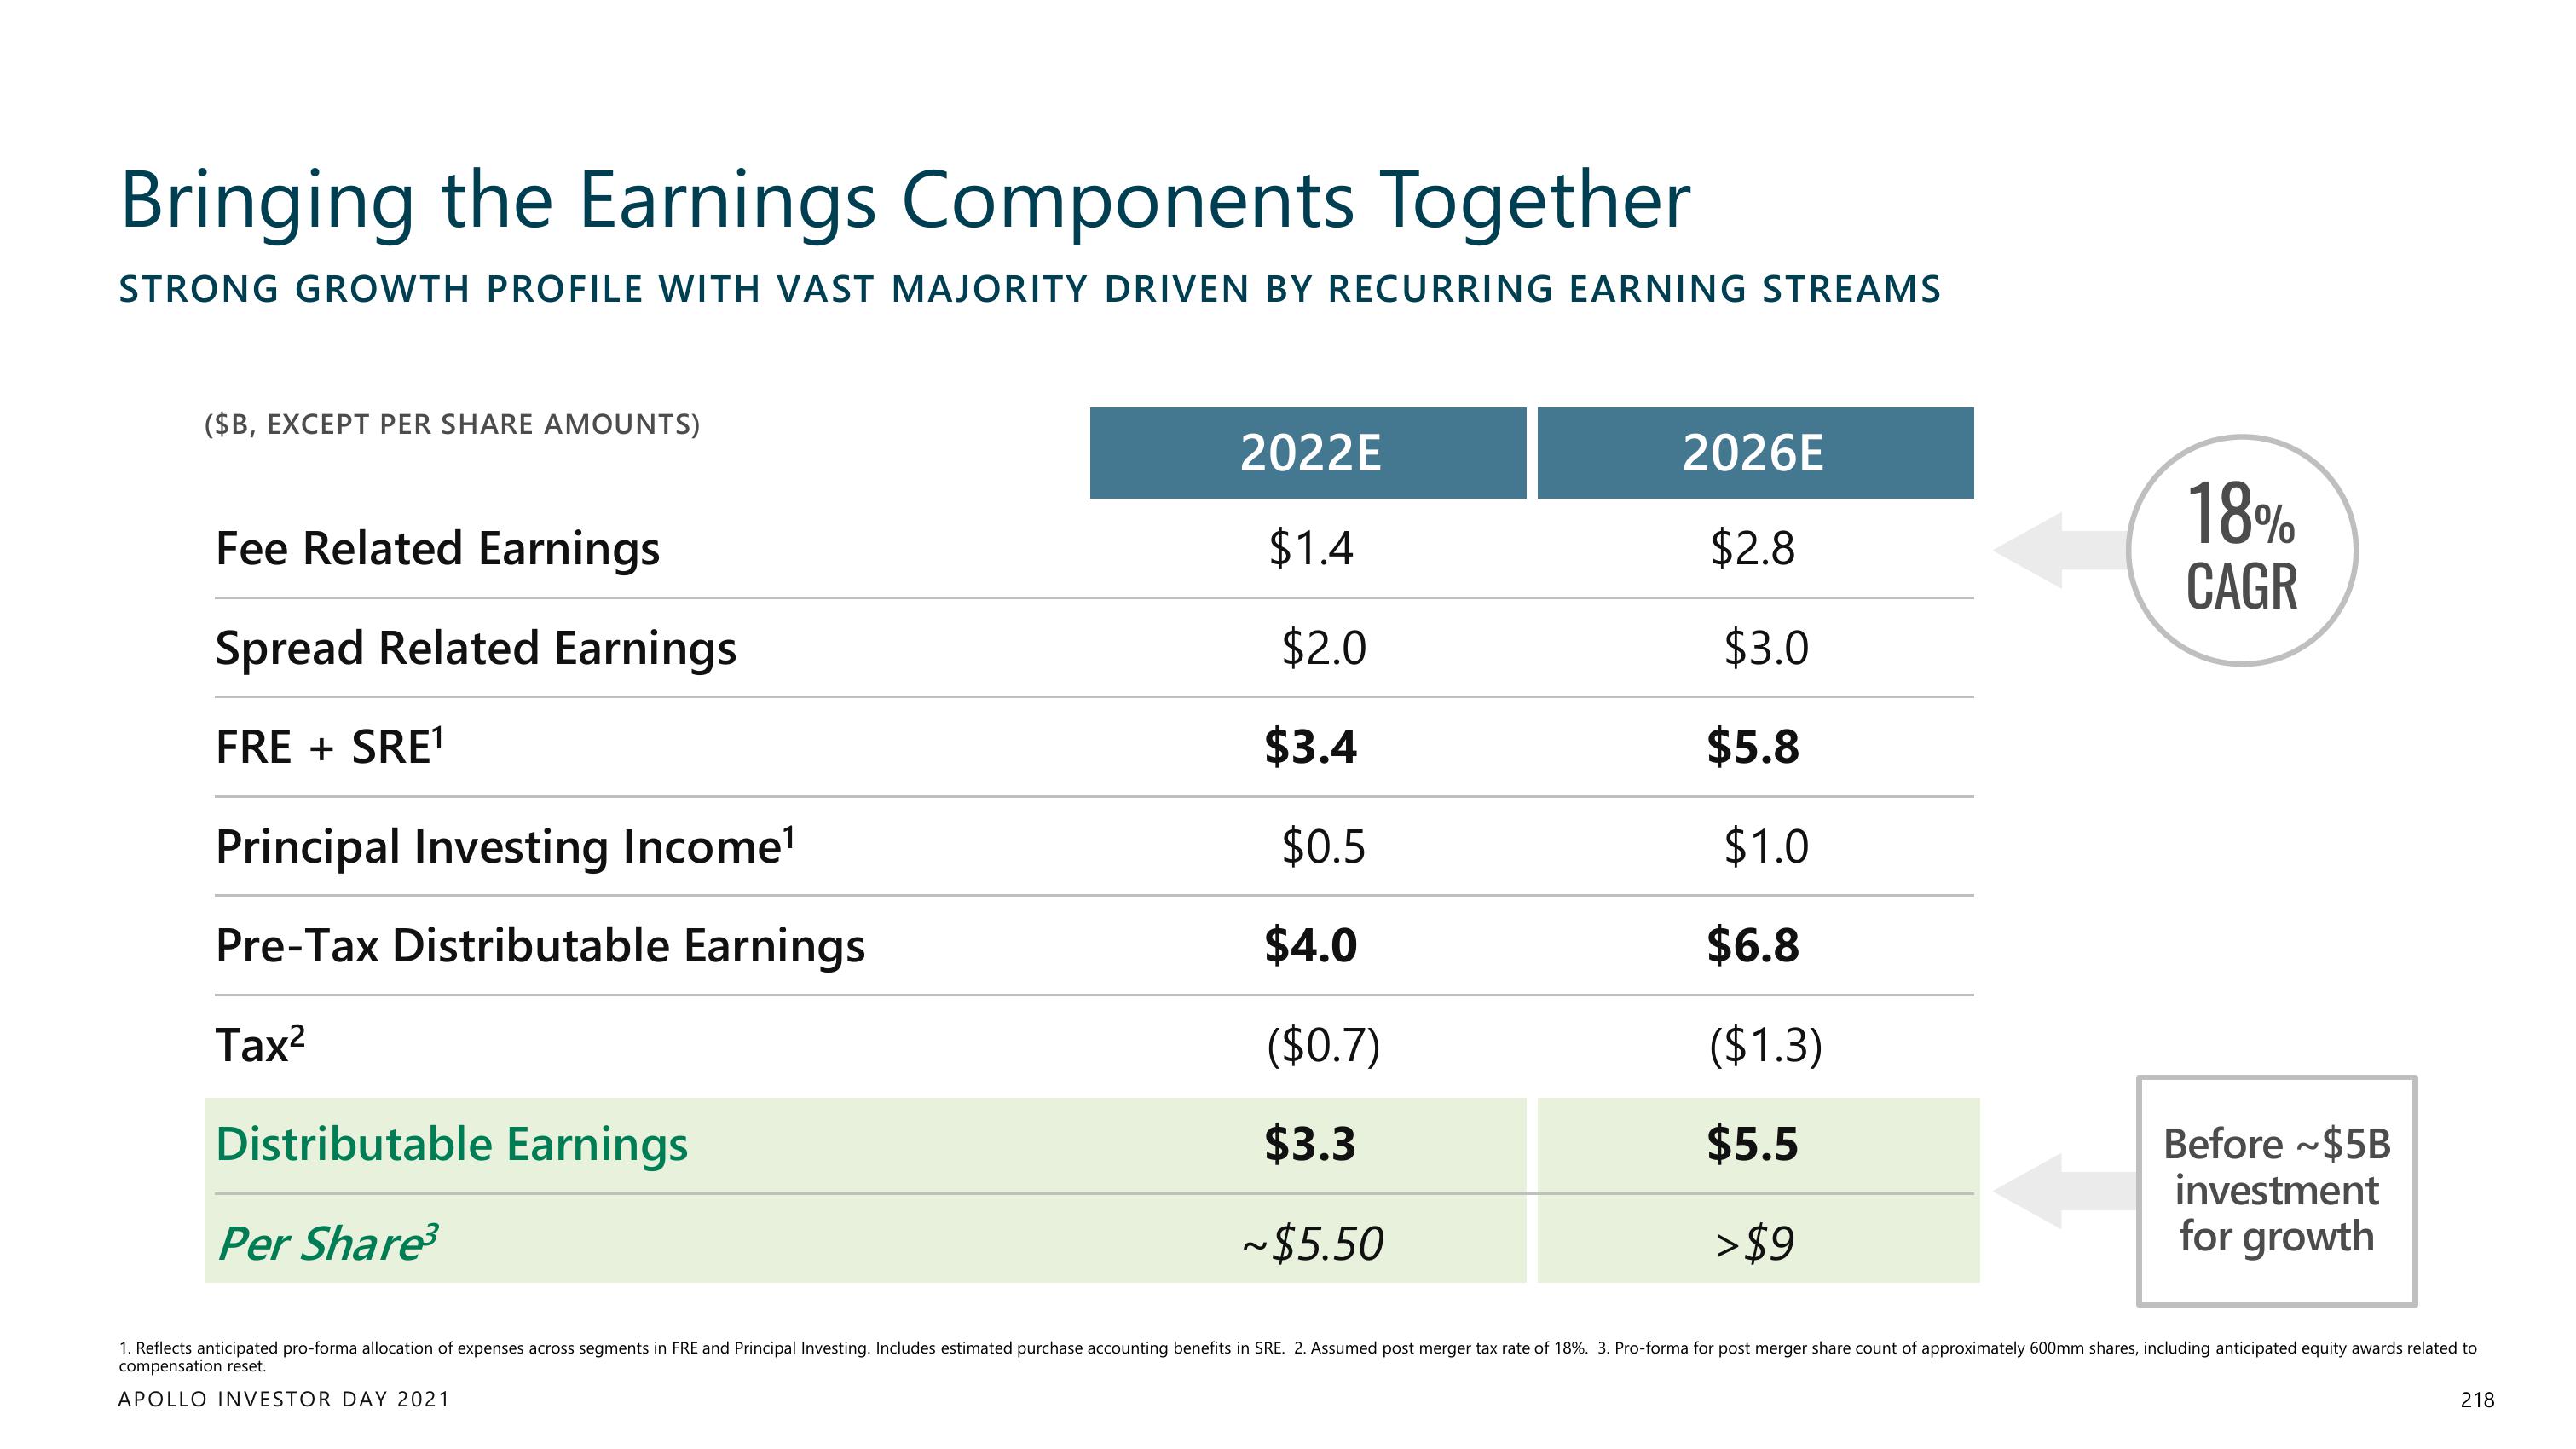
Bringing the Earnings Components Together
STRONG GROWTH PROFILE WITH VAST MAJORITY DRIVEN BY RECURRING EARNING STREAMS
($B, EXCEPT PER SHARE AMOUNTS)
Fee Related Earnings
Spread Related Earnings
FRE + SRE¹
Principal Investing Income¹
Pre-Tax Distributable Earnings
Tax²
Distributable Earnings
Per Share³
2022E
$1.4
$2.0
$3.4
$0.5
$4.0
($0.7)
$3.3
~$5.50
2026E
$2.8
$3.0
$5.8
$1.0
$6.8
($1.3)
$5.5
> $9
18%
CAGR
Before ~$5B
investment
for growth
1. Reflects anticipated pro-forma allocation of expenses across segments in FRE and Principal Investing. Includes estimated purchase accounting benefits in SRE. 2. Assumed post merger tax rate of 18%. 3. Pro-forma for post merger share count of approximately 600mm shares, including anticipated equity awards related to
compensation reset.
APOLLO INVESTOR DAY 2021
218View entire presentation