Apollo Global Management Investor Day Presentation Deck slide image

Apollo Global Management Investor Day Presentation Deck

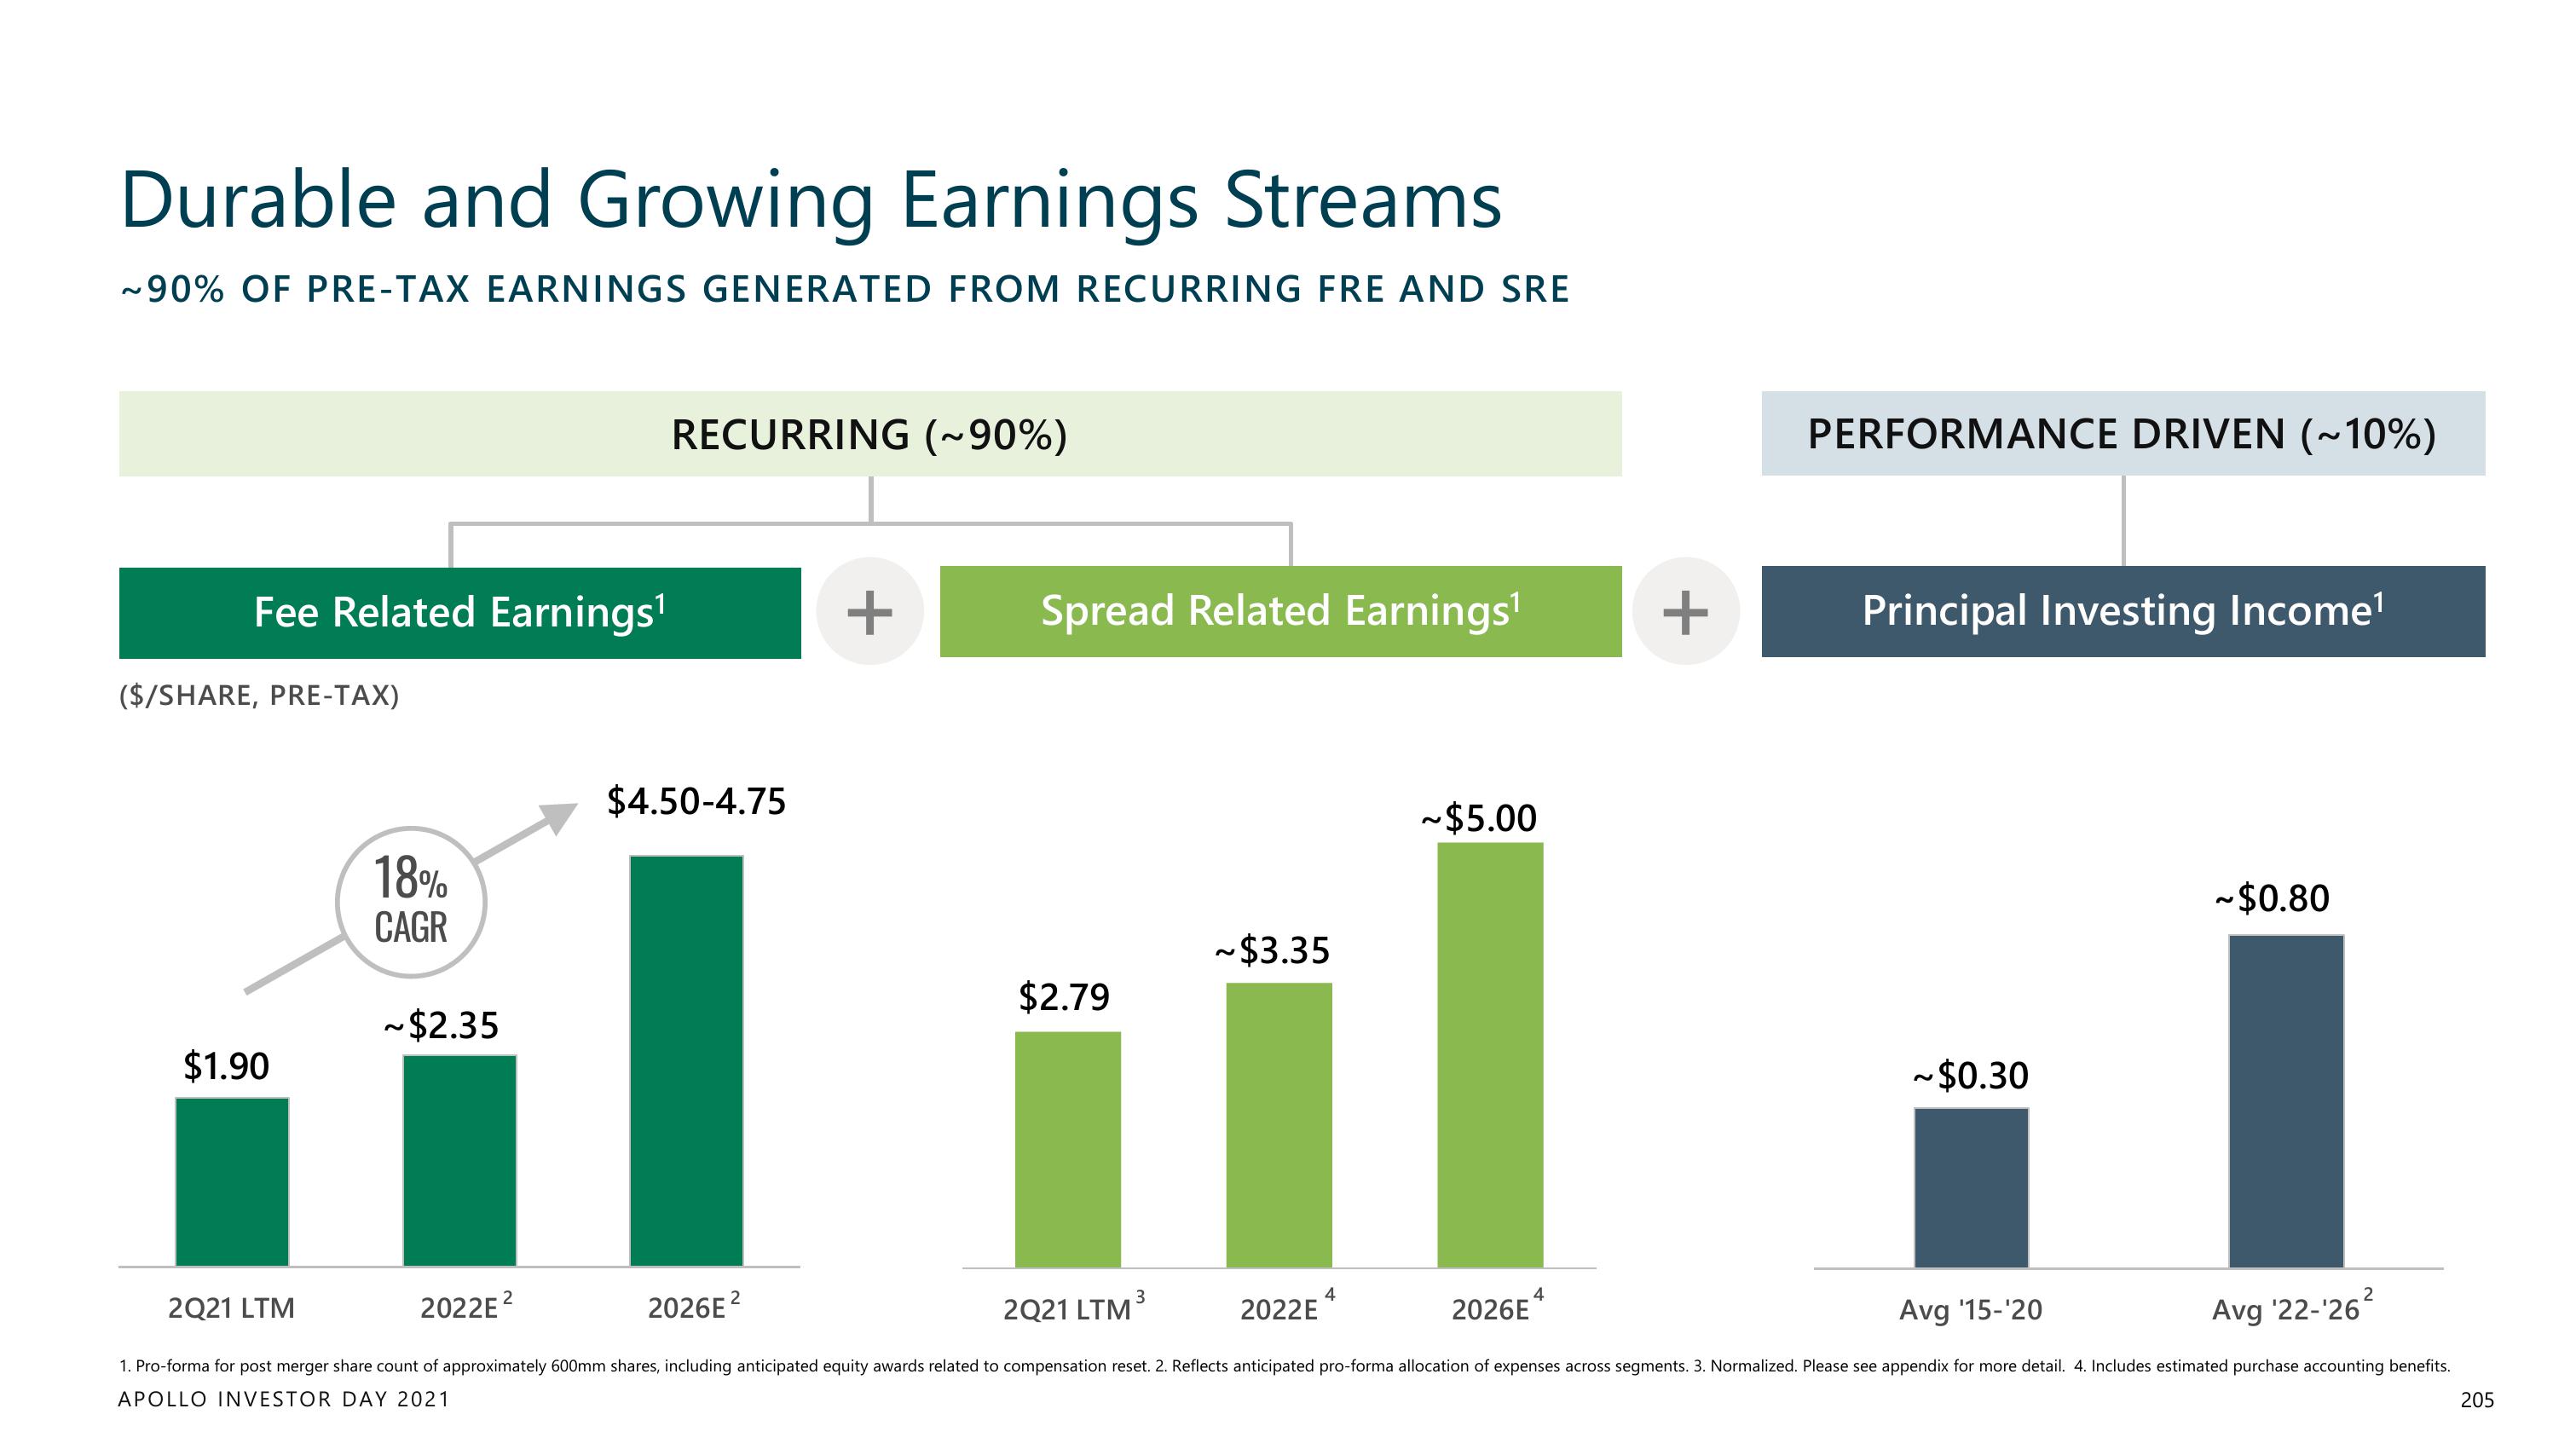
Durable and Growing Earnings Streams ~90% OF PRE-TAX EARNINGS GENERATED FROM RECURRING FRE AND SRE Fee Related Earnings¹ ($/SHARE, PRE-TAX) $1.90 18% CAGR ~$2.35 RECURRING (~90%) $4.50-4.75 + Spread Related Earnings¹ $2.79 ~$3.35 2022E 4 ~$5.00 4 2026E + PERFORMANCE DRIVEN (~10%) Principal Investing Income¹ ~$0.30 2Q21 LTM 2022E² 2026E² 2Q21 LTM³ Avg '15-'20 1. Pro-forma for post merger share count of approximately 600mm shares, including anticipated equity awards related to compensation reset. 2. Reflects anticipated pro-forma allocation of expenses across segments. 3. Normalized. Please see appendix for more detail. 4. Includes estimated purchase accounting benefits. APOLLO INVESTOR DAY 2021 Avg '22-¹26² ~$0.80 205
View entire presentation