KLA Investor Day Presentation Deck
ŞM
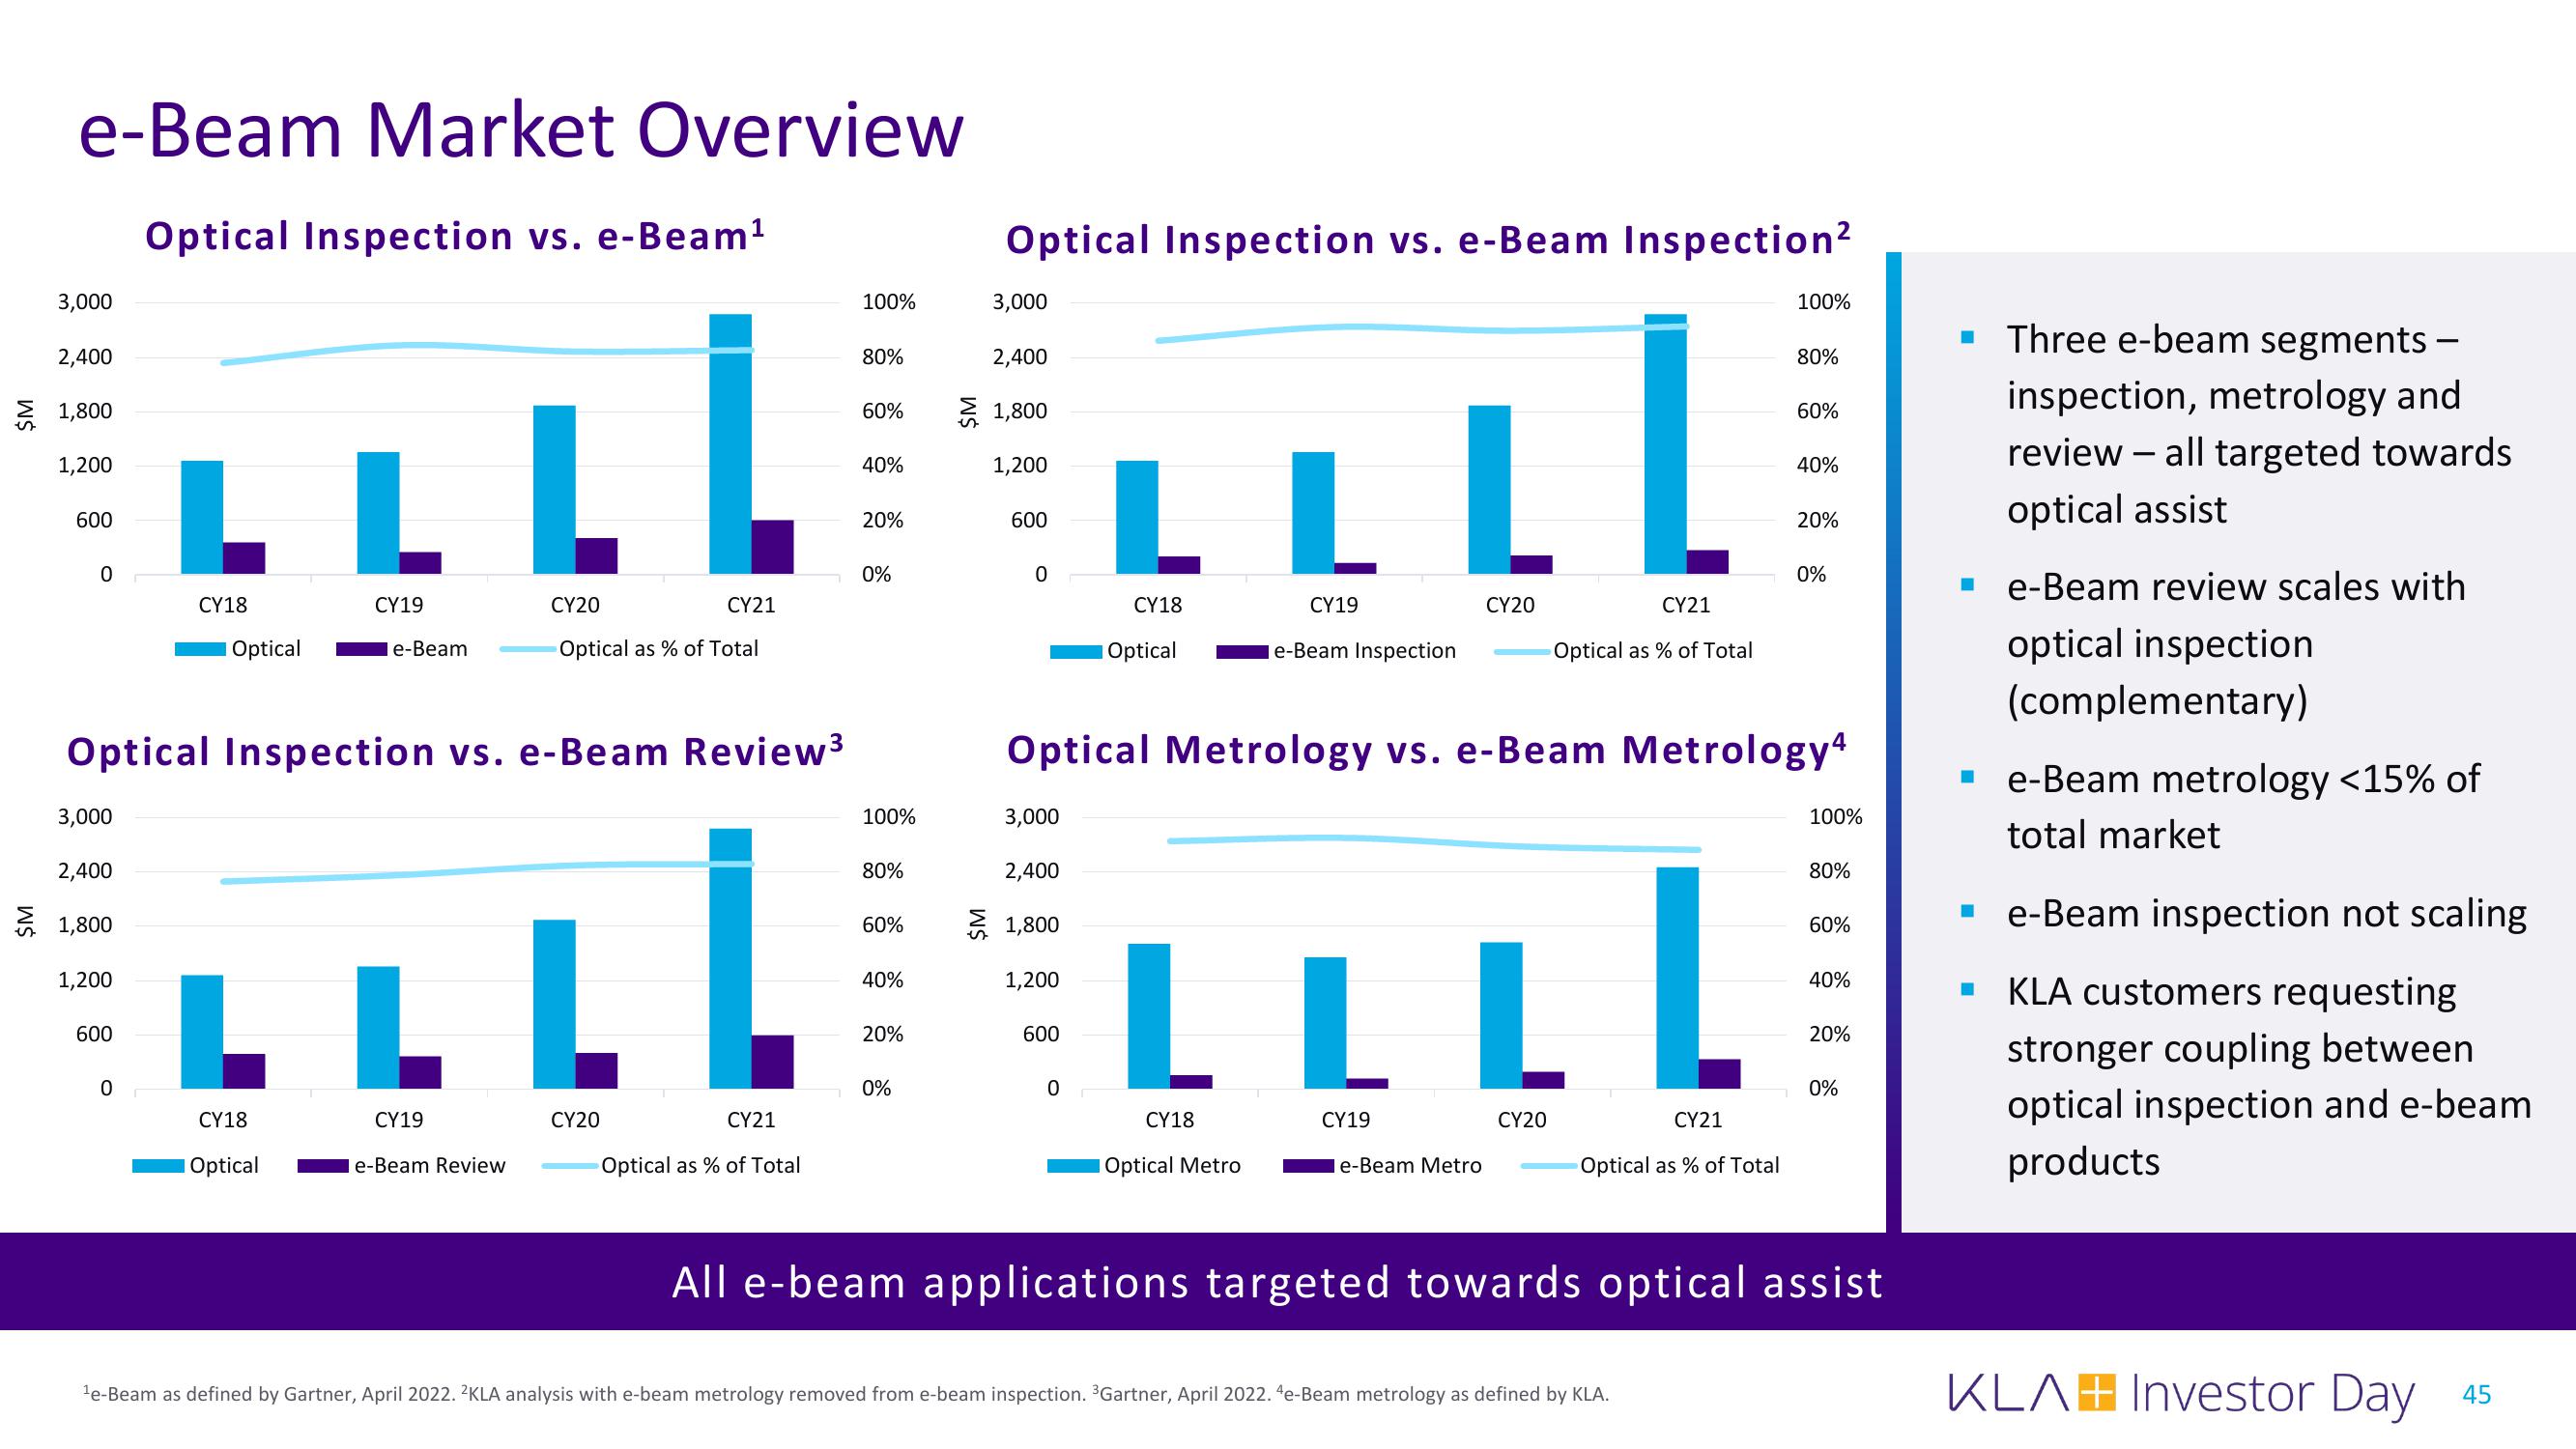
e-Beam Market Overview
Optical Inspection vs. e-Beam¹
3,000
2,400
1,800
1,200
600
0
3,000
2,400
> 1,800
1,200
600
เ
CY18
0
Optical
Optical Inspection vs. e-Beam Review³
เ
เ
CY18
Optical
CY19
le-Beam
CY20
CY21
Optical as % of Total
CY19
e-Beam Review
CY20
CY21
Optical as % of Total
100%
80%
60%
40%
20%
0%
100%
80%
60%
40%
20%
0%
Optical Inspection vs. e-Beam Inspection²
3,000
2,400
1,800
1,200
600
0
3,000
2,400
1,800
1,200
600
CY18
Optical
0
CY18
Optical Metro
il
CY19
e-Beam Inspection
CY19
Optical Metrology vs. e-Beam Metrology4
CY20
le-Beam Metro
CY21
Optical as % of Total
CY20
CY21
Optical as % of Total
100%
80%
¹e-Beam as defined by Gartner, April 2022. 2KLA analysis with e-beam metrology removed from e-beam inspection. ³Gartner, April 2022. 4e-Beam metrology as defined by KLA.
60%
40%
20%
0%
100%
80%
60%
40%
20%
0%
All e-beam applications targeted towards optical assist
▪ Three e-beam segments -
inspection, metrology and
review - all targeted towards
optical assist
I e-Beam review scales with
optical inspection
(complementary)
■ e-Beam metrology <15% of
total market
-
e-Beam inspection not scaling
KLA customers requesting
stronger coupling between
optical inspection and e-beam
products
KLAH Investor Day
45View entire presentation