Paysafe Results Presentation Deck
Q1 summary of consolidated results
$ in millions
Revenue
Gross Profit (excluding D&A)
Margin %
Adj. EBITDA
Margin %
Depreciation and amortization
Interest expense, net
Net loss attributable to Paysafe(¹)
Paysafe:
Q1'21
$377.4
$226.4
60.0%
$113.2
30.0%
$65.5
$62.4
($60.6)
Q1'22
$367.7
$220.6
60.0%
$104.0
28.3%
$63.4
$26.0
($1,171.2)
Change
(3%)
flat cc
(3%)
(8%)
(3%)
(58%)
NM
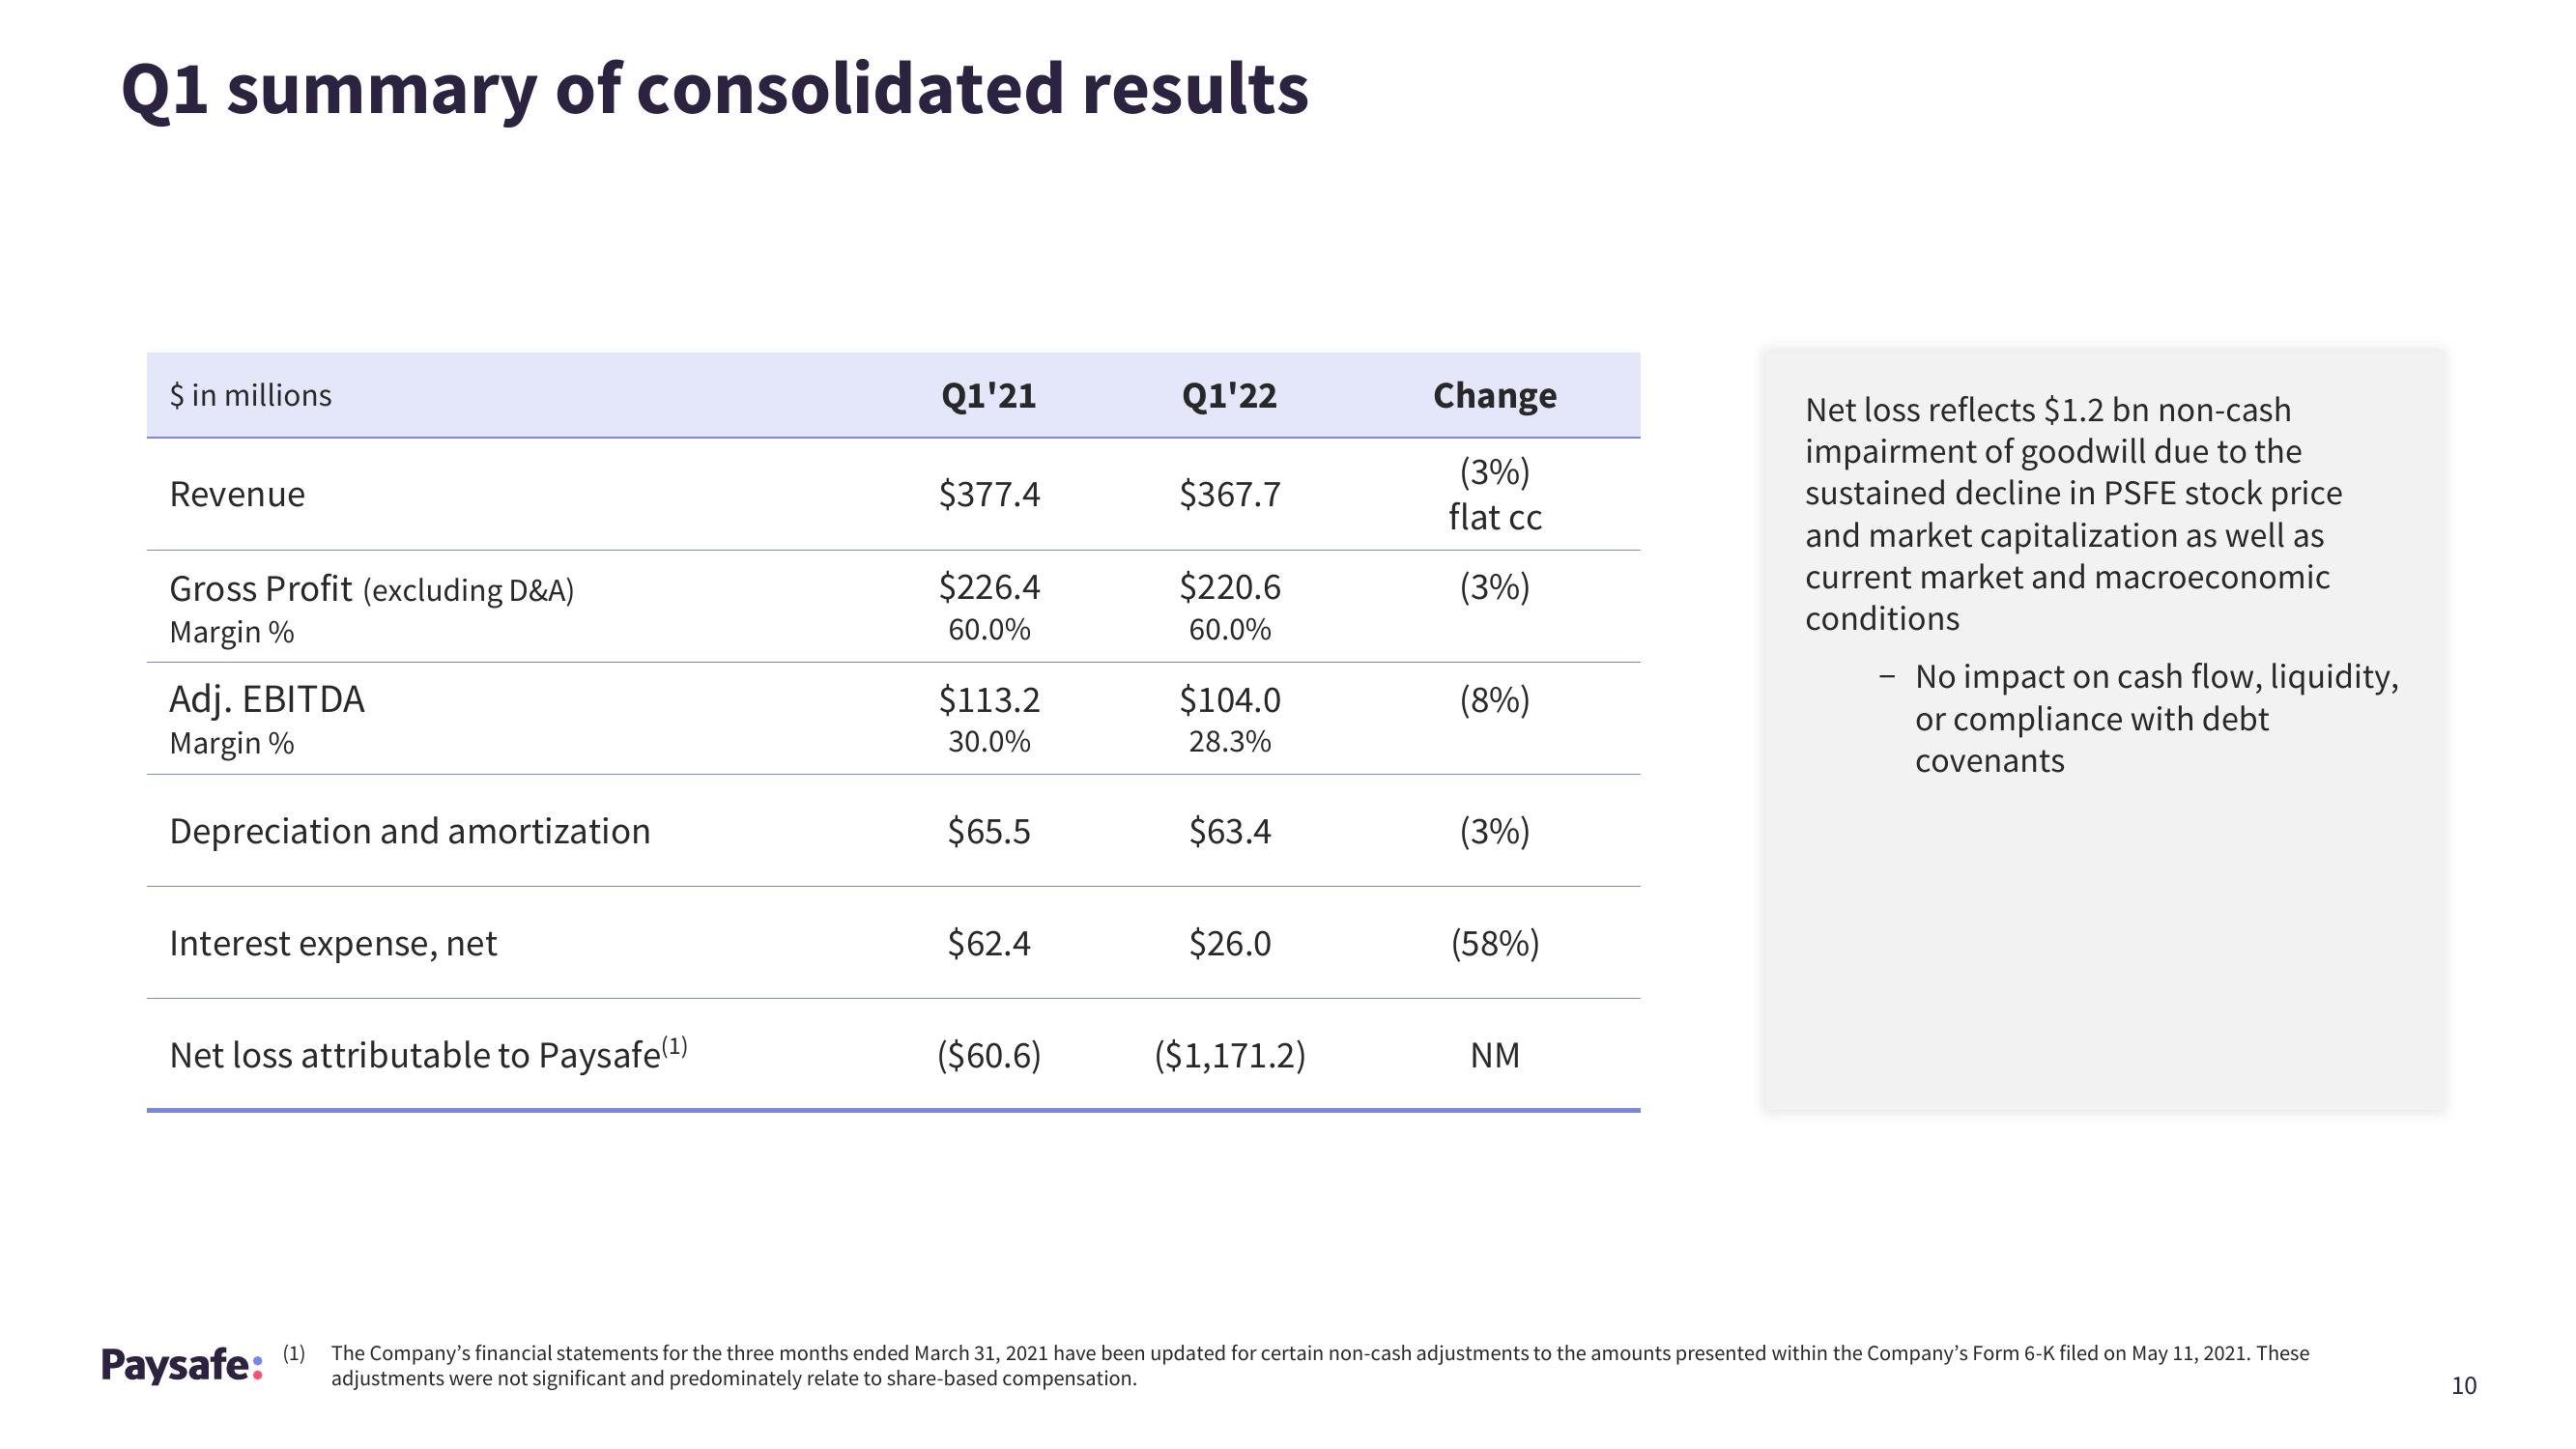
Net loss reflects $1.2 bn non-cash
impairment of goodwill due to the
sustained decline in PSFE stock price
and market capitalization as well as
current market and macroeconomic
conditions
- No impact on cash flow, liquidity,
or compliance with debt
covenants
(1)
The Company's financial statements for the three months ended March 31, 2021 have been updated for certain non-cash adjustments to the amounts presented within the Company's Form 6-K filed on May 11, 2021. These
adjustments were not significant and predominately relate to share-based compensation.
10View entire presentation