JD Sports Results Presentation Deck
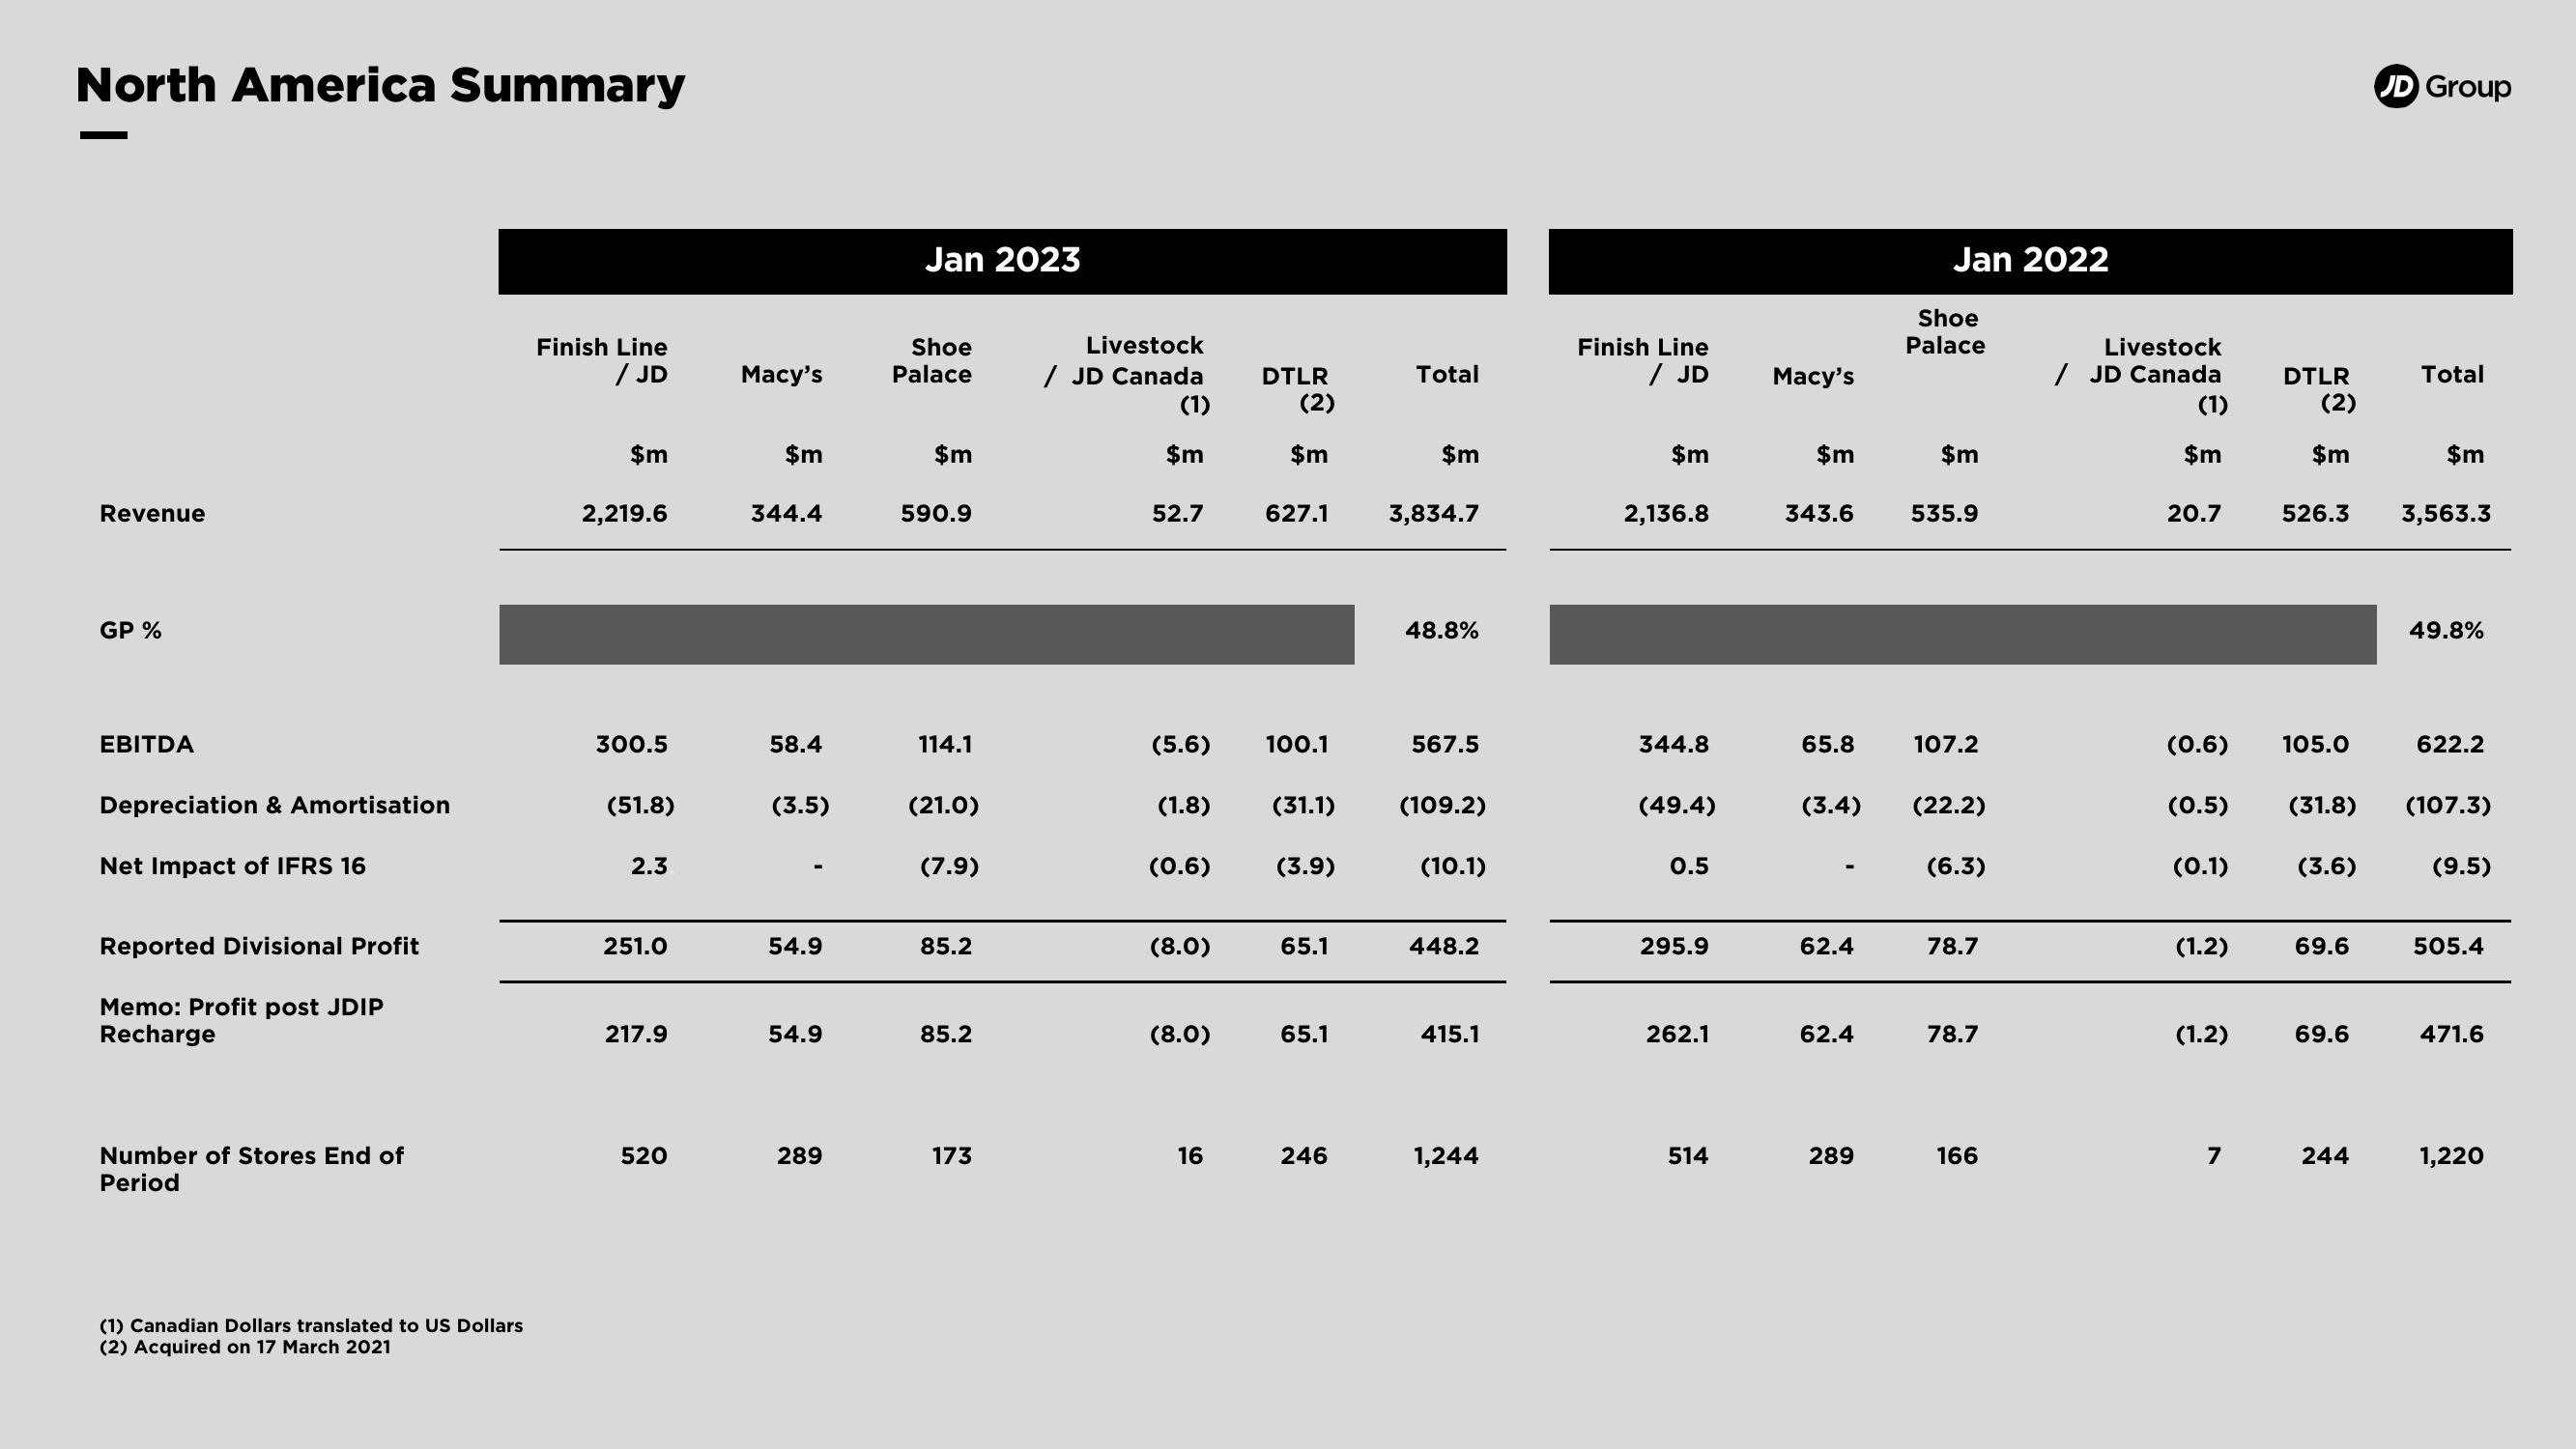
North America Summary
Revenue
GP %
EBITDA
Depreciation & Amortisation
Net Impact of IFRS 16
Reported Divisional Profit
Memo: Profit post JDIP
Recharge
Number of Stores End of
Period
(1) Canadian Dollars translated to US Dollars
(2) Acquired on 17 March 2021
Finish Line
/JD
$m
2,219.6
300.5
(51.8)
2.3
251.0
217.9
520
Macy's
$m
344.4
58.4
(3.5)
54.9
54.9
289
Jan 2023
Shoe
Palace
$m
590.9
114.1
(21.0)
(7.9)
85.2
85.2
173
Livestock
/ JD Canada
(1)
$m
52.7
(5.6) 100.1
(1.8)
(0.6)
(8.0)
(8.0)
16
DTLR
(2)
$m
627.1 3,834.7
(31.1)
(3.9)
65.1
65.1
Total
246
$m
48.8%
567.5
(109.2)
(10.1)
448.2
415.1
1,244
Finish Line
/ JD
$m
2,136.8
344.8
(49.4)
0.5
295.9
262.1
514
Macy's
$m
343.6
65.8
62.4
62.4
Jan 2022
289
Shoe
Palace
$m
(3.4) (22.2)
535.9
107.2
(6.3)
78.7
78.7
166
Livestock
/ JD Canada
(1)
$m
20.7
(1.2)
(0.6) 105.0
(0.5)
(0.1)
(1.2)
DTLR
(2)
$m
7
(31.8)
526.3 3,563.3
(3.6)
69.6
69.6
JD Group
244
Total
$m
49.8%
622.2
(107.3)
(9.5)
505.4
471.6
1,220View entire presentation