ACV Auctions Investor Day Presentation Deck
SCALE
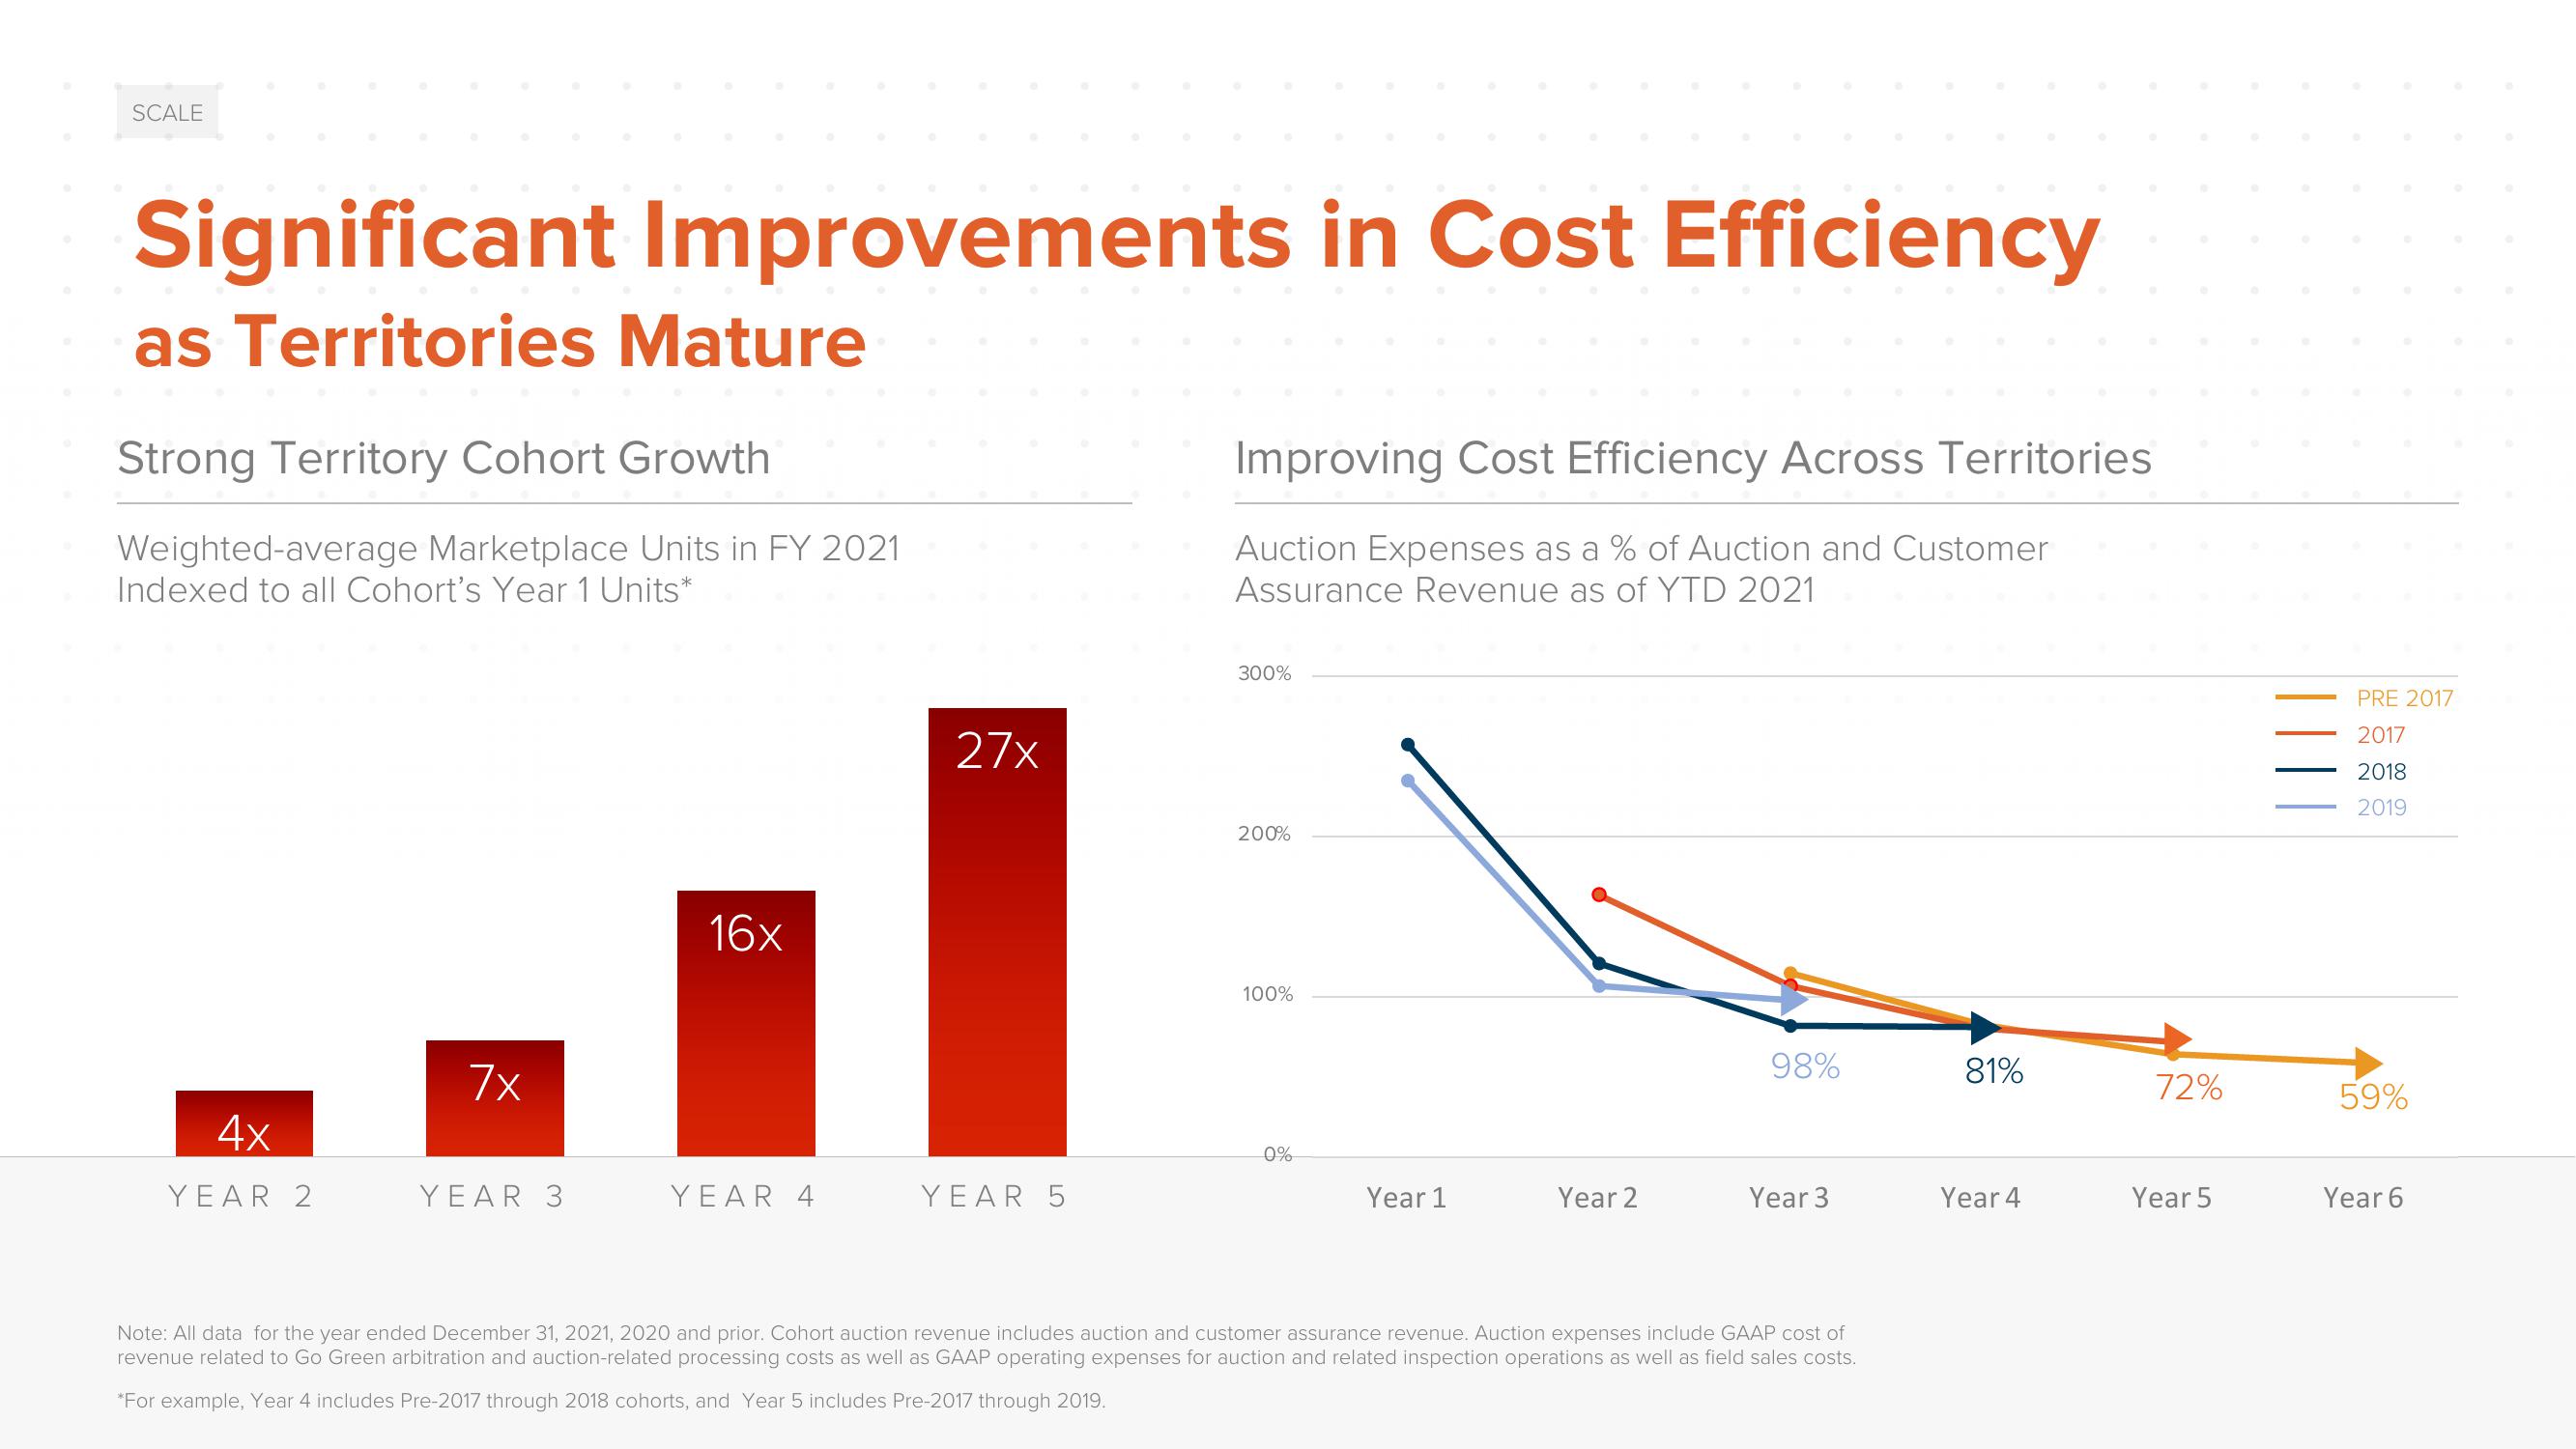
Significant Improvements in Cost Efficiency
as Territories Mature
Strong Territory Cohort Growth
Weighted-average Marketplace Units in FY 2021
Indexed to all Cohort's Year 1 Units*
4x
YEAR 2
7x
YEAR 3
16x
YEAR 4
27x
YEAR 5
Improving Cost Efficiency Across Territories
Auction Expenses as a % of Auction and Customer
Assurance Revenue as of YTD 2021
300%
200%
100%
0%
Year 1
Year 2
98%
Year 3
Note: All data for the year ended December 31, 2021, 2020 and prior. Cohort auction revenue includes auction and customer assurance revenue. Auction expenses include GAAP cost of
revenue related to Go Green arbitration and auction-related processing costs as well as GAAP operating expenses for auction and related inspection operations as well as field sales costs.
*For example, Year 4 includes Pre-2017 through 2018 cohorts, and Year 5 includes Pre-2017 through 2019.
81%
Year 4
72%
Year 5
PRE 2017
2017
2018
2019
59%
Year 6View entire presentation