KLA Investor Day Presentation Deck slide image

KLA Investor Day Presentation Deck

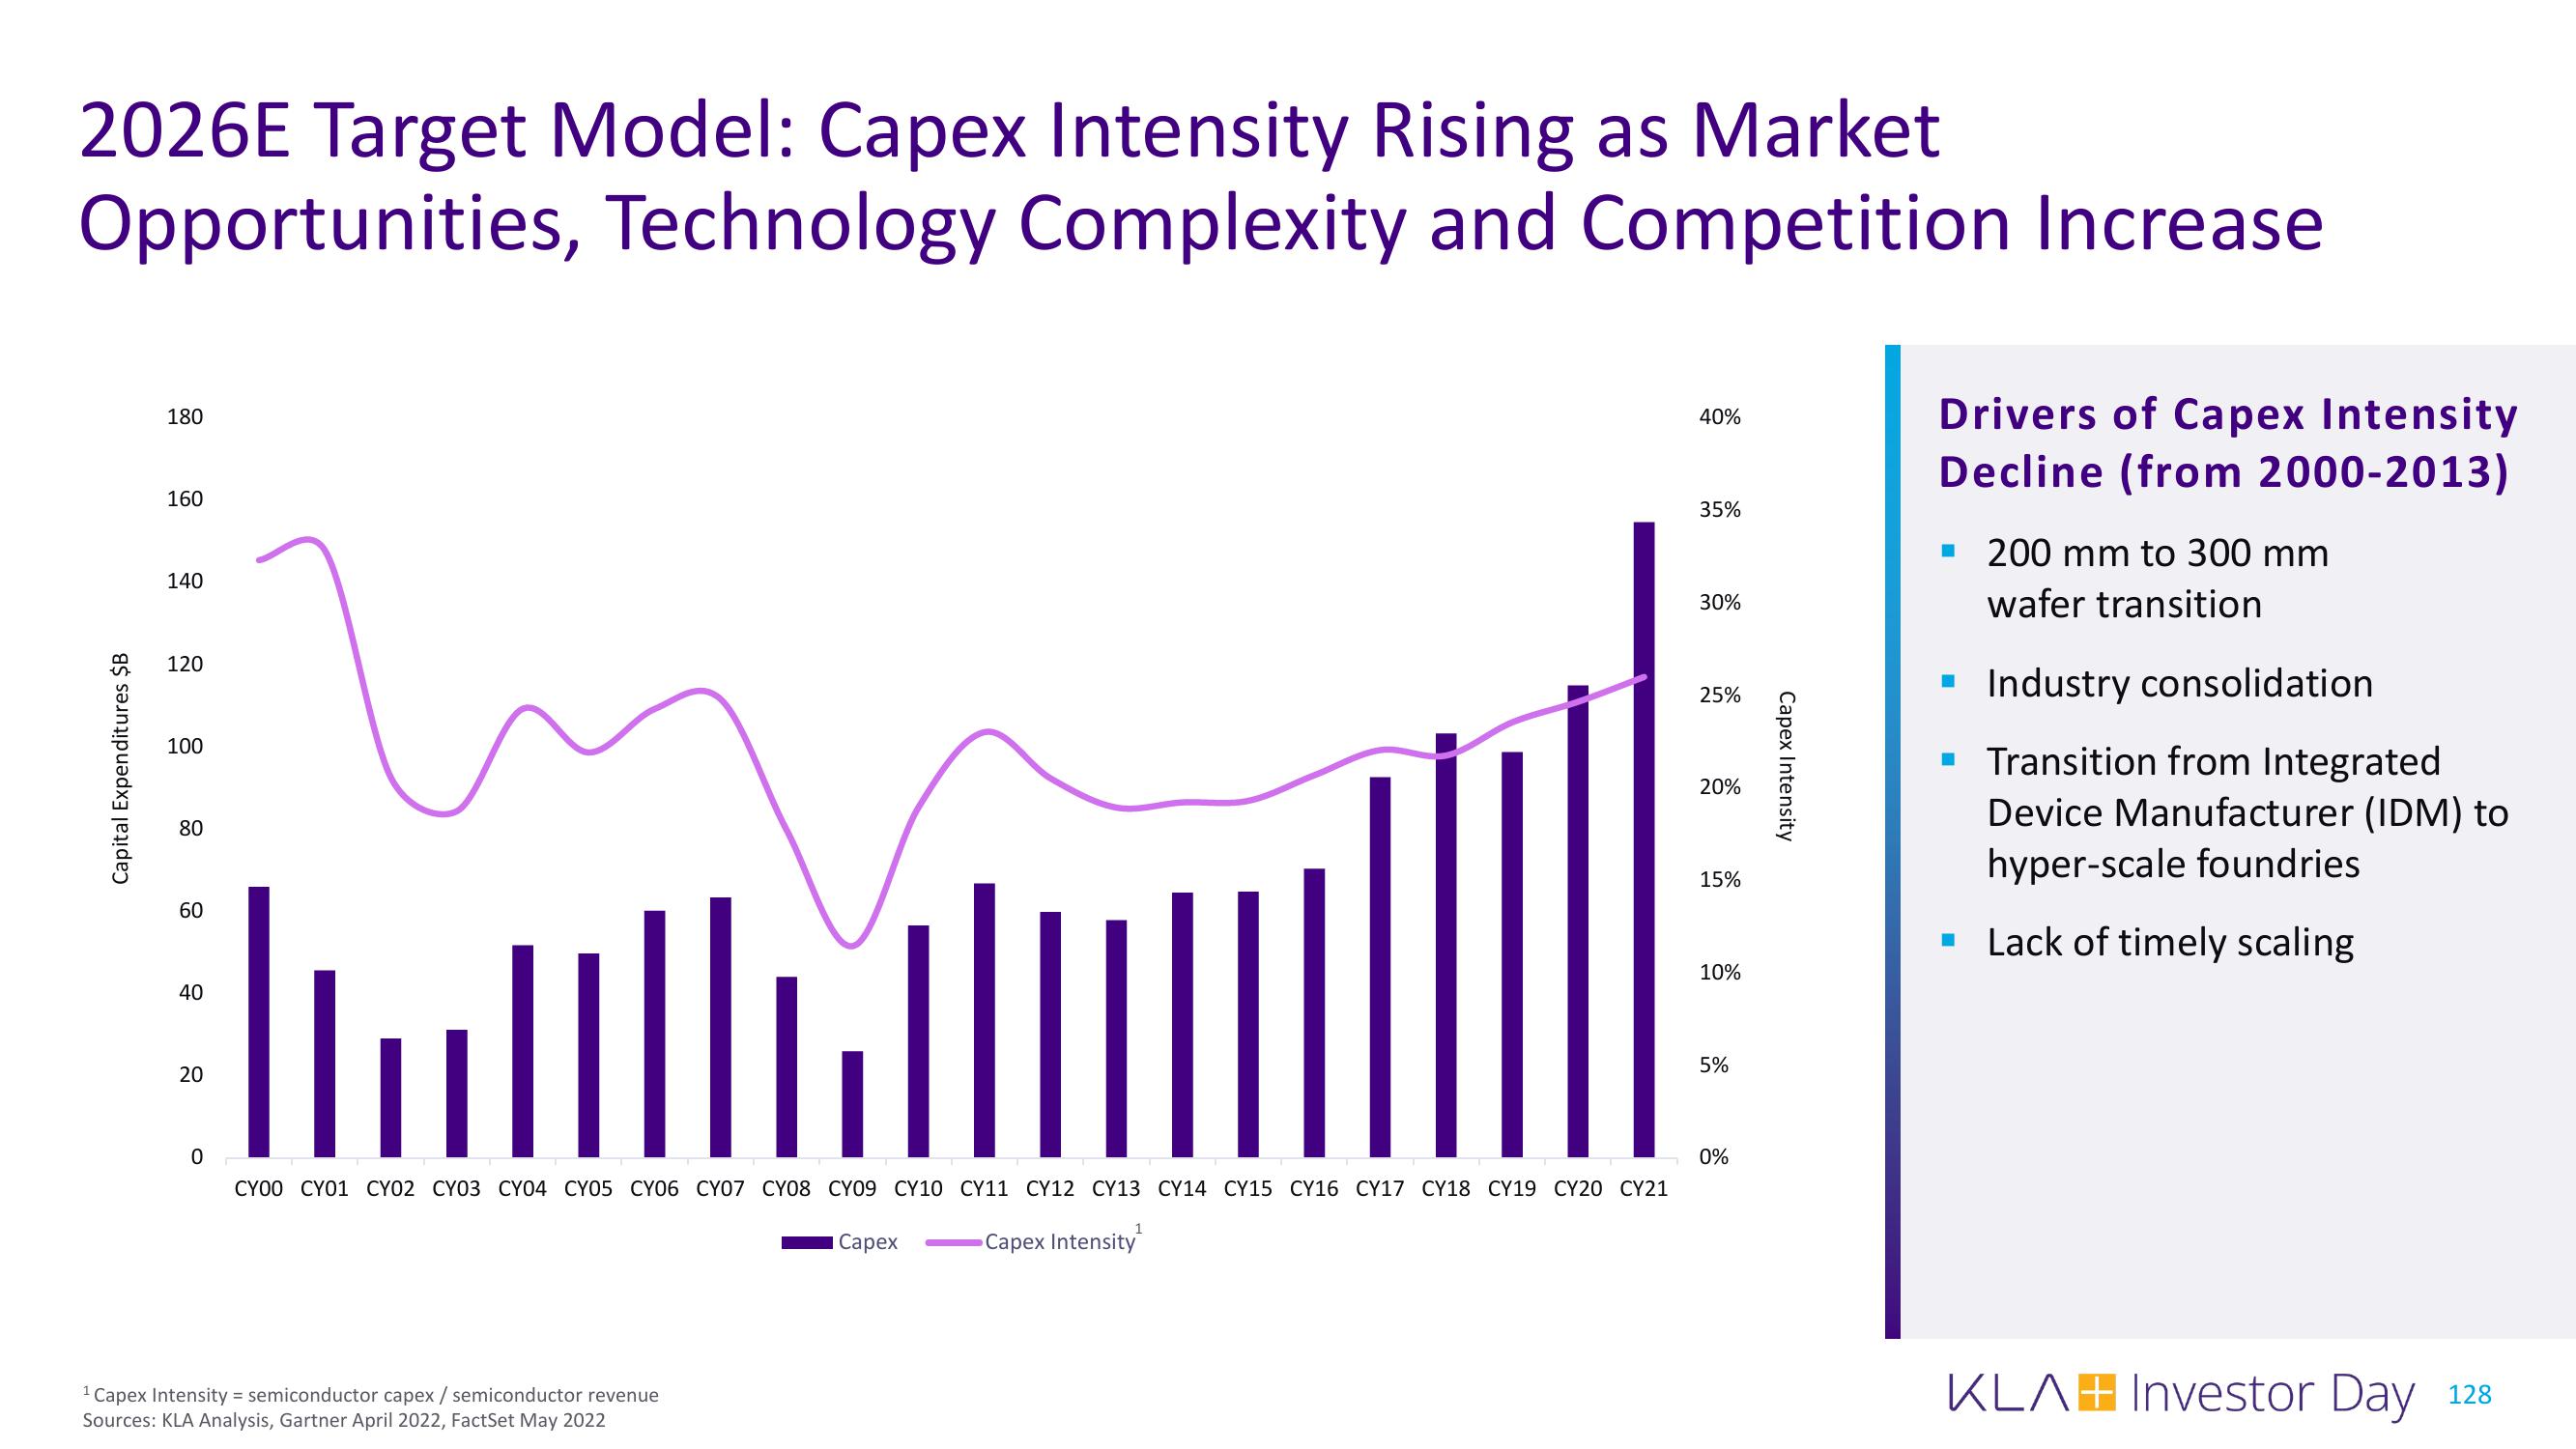
2026E Target Model: Capex Intensity Rising as Market Opportunities, Technology Complexity and Competition Increase Capital Expenditures $B 180 160 140 120 100 80 60 40 20 0 CYOO CY01 CY02 CY03 CY04 CY05 CY06 CY07 CY08 CY09 CY10 CY11 CY12 CY13 CY14 CY15 CY16 CY17 CY18 CY19 CY20 CY21 ¹ Capex Intensity = semiconductor capex / semiconductor revenue Sources: KLA Analysis, Gartner April 2022, FactSet May 2022 Capex Capex Intensity 40% 35% 30% 25% 20% 15% 10% 5% 0% Capex Intensity Drivers of Capex Intensity Decline (from 2000-2013) ■ 200 mm to 300 mm wafer transition Industry consolidation Transition from Integrated Device Manufacturer (IDM) to hyper-scale foundries ■ Lack of timely scaling ▪ ■ KLAH Investor Day 128
View entire presentation