Broadridge Financial Solutions Results Presentation Deck
00.00
0
6
120
Reconciliation of Non-GAAP to GAAP measures: Fiscal Year
2022 guidance
(Unaudited)
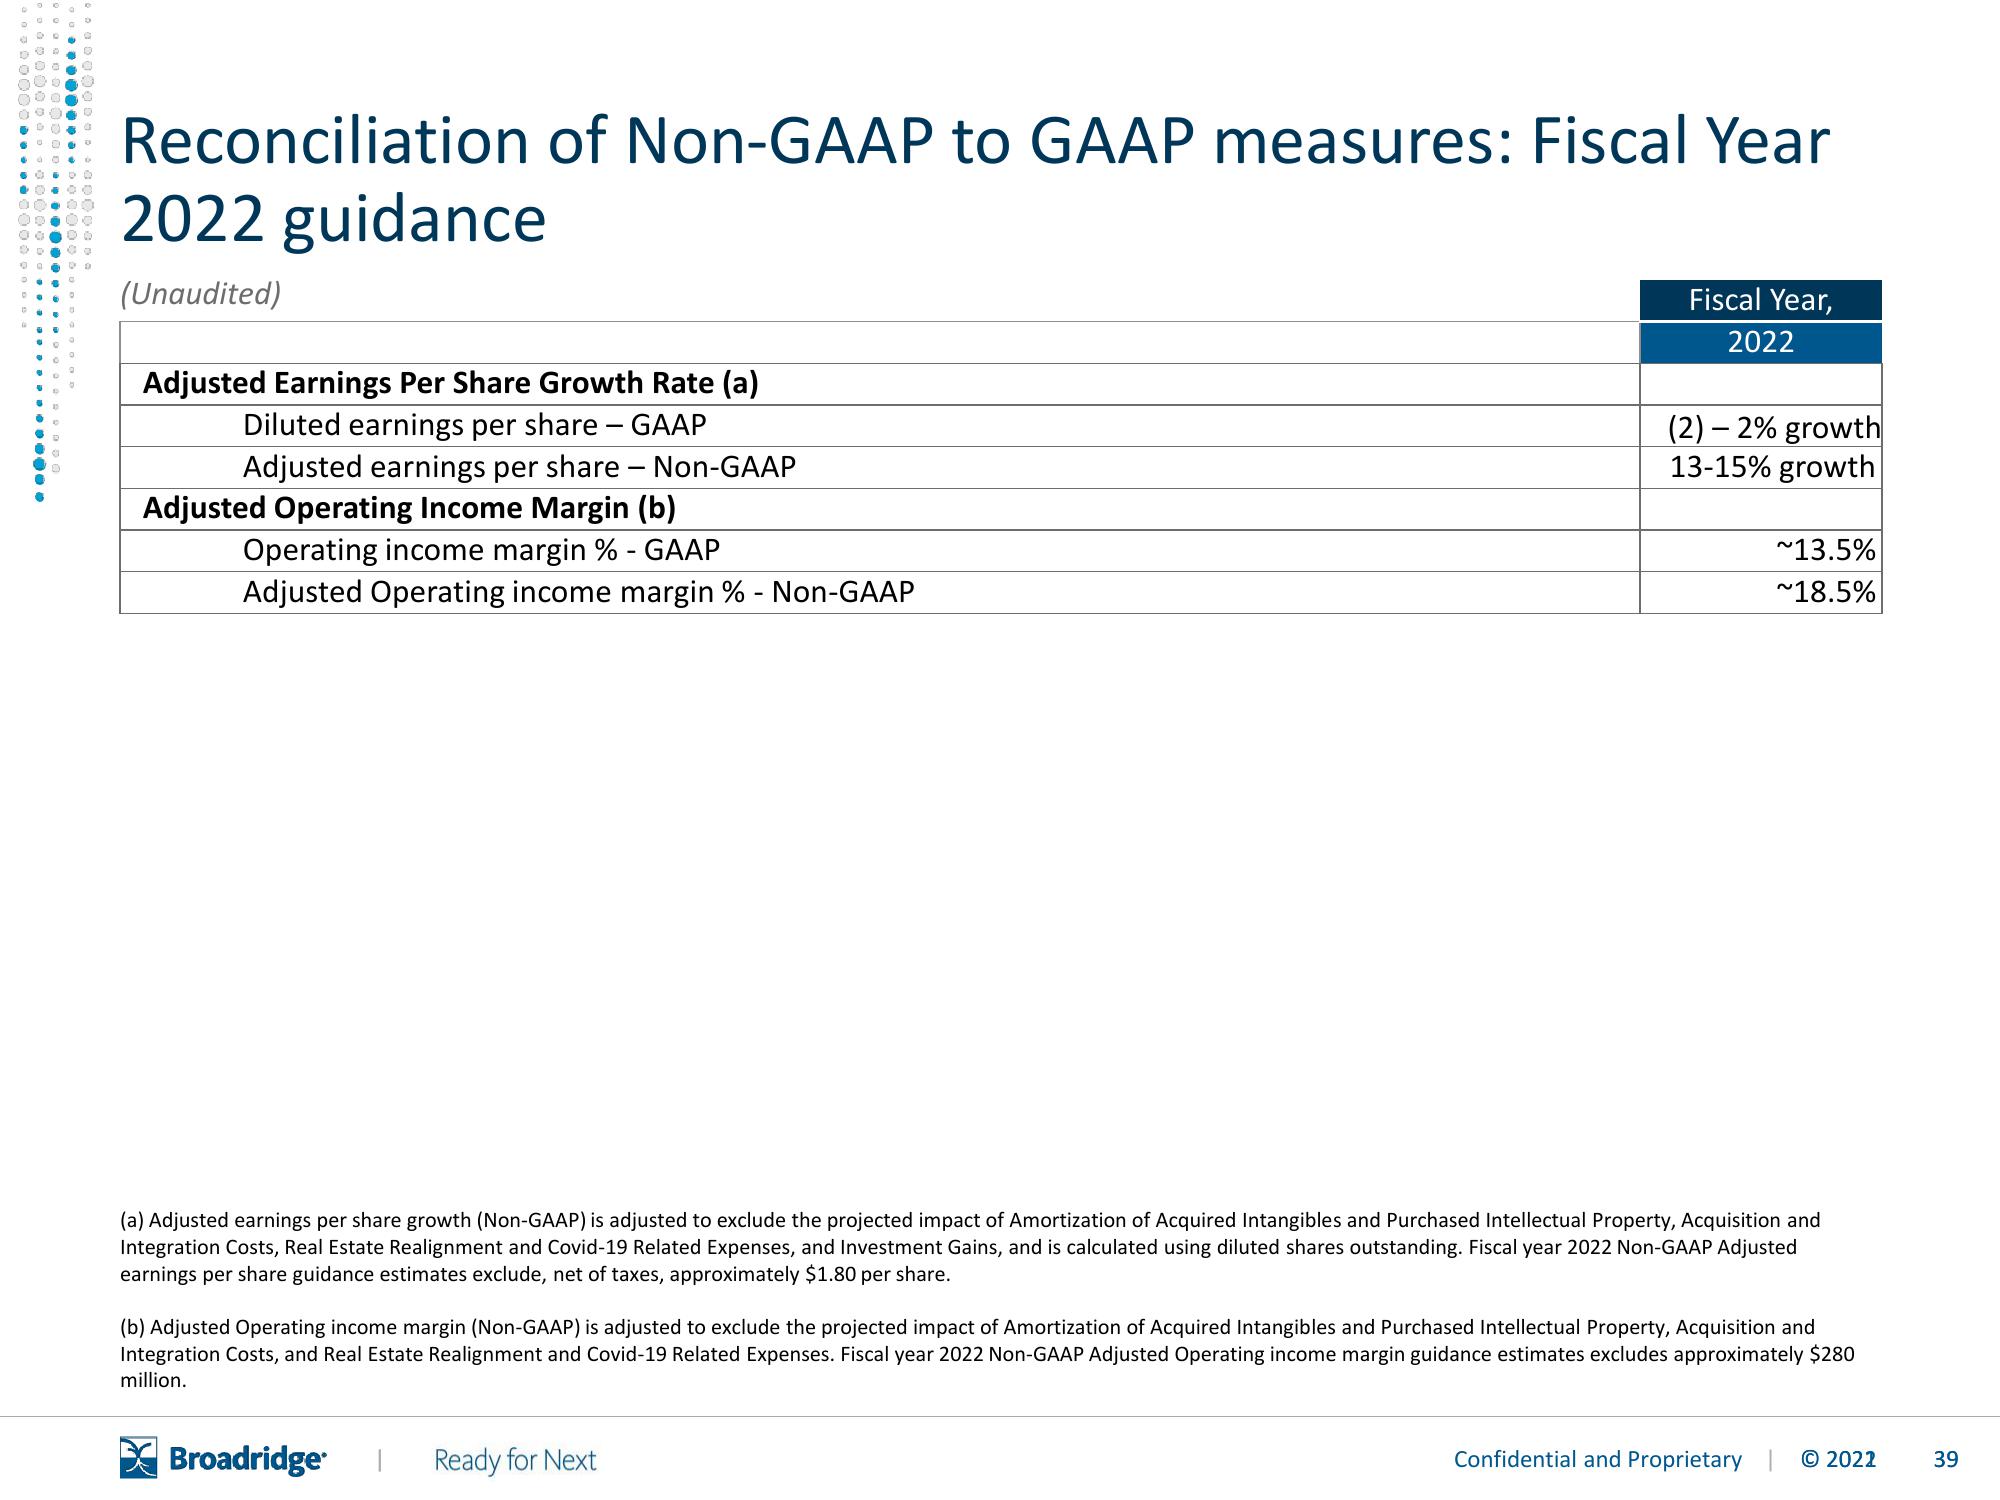
Adjusted Earnings Per Share Growth Rate (a)
Diluted earnings per share - GAAP
Adjusted earnings per share - Non-GAAP
Adjusted Operating Income Margin (b)
Operating income margin % - GAAP
Adjusted Operating income margin % - Non-GAAP
Fiscal Year,
2022
Broadridge
(2) - 2% growth
13-15% growth
(a) Adjusted earnings per share growth (Non-GAAP) is adjusted to exclude the projected impact of Amortization of Acquired Intangibles and Purchased Intellectual Property, Acquisition and
Integration Costs, Real Estate Realignment and Covid-19 Related Expenses, and Investment Gains, and is calculated using diluted shares outstanding. Fiscal year 2022 Non-GAAP Adjusted
earnings per share guidance estimates exclude, net of taxes, approximately $1.80 per share.
Ready for Next
(b) Adjusted Operating income margin (Non-GAAP) is adjusted to exclude the projected impact of Amortization of Acquired Intangibles and Purchased Intellectual Property, Acquisition and
Integration Costs, and Real Estate Realignment and Covid-19 Related Expenses. Fiscal year 2022 Non-GAAP Adjusted Operating income margin guidance estimates excludes approximately $280
million.
~13.5%
~18.5%
Confidential and Proprietary
© 2022
39View entire presentation