JD Sports Results Presentation Deck
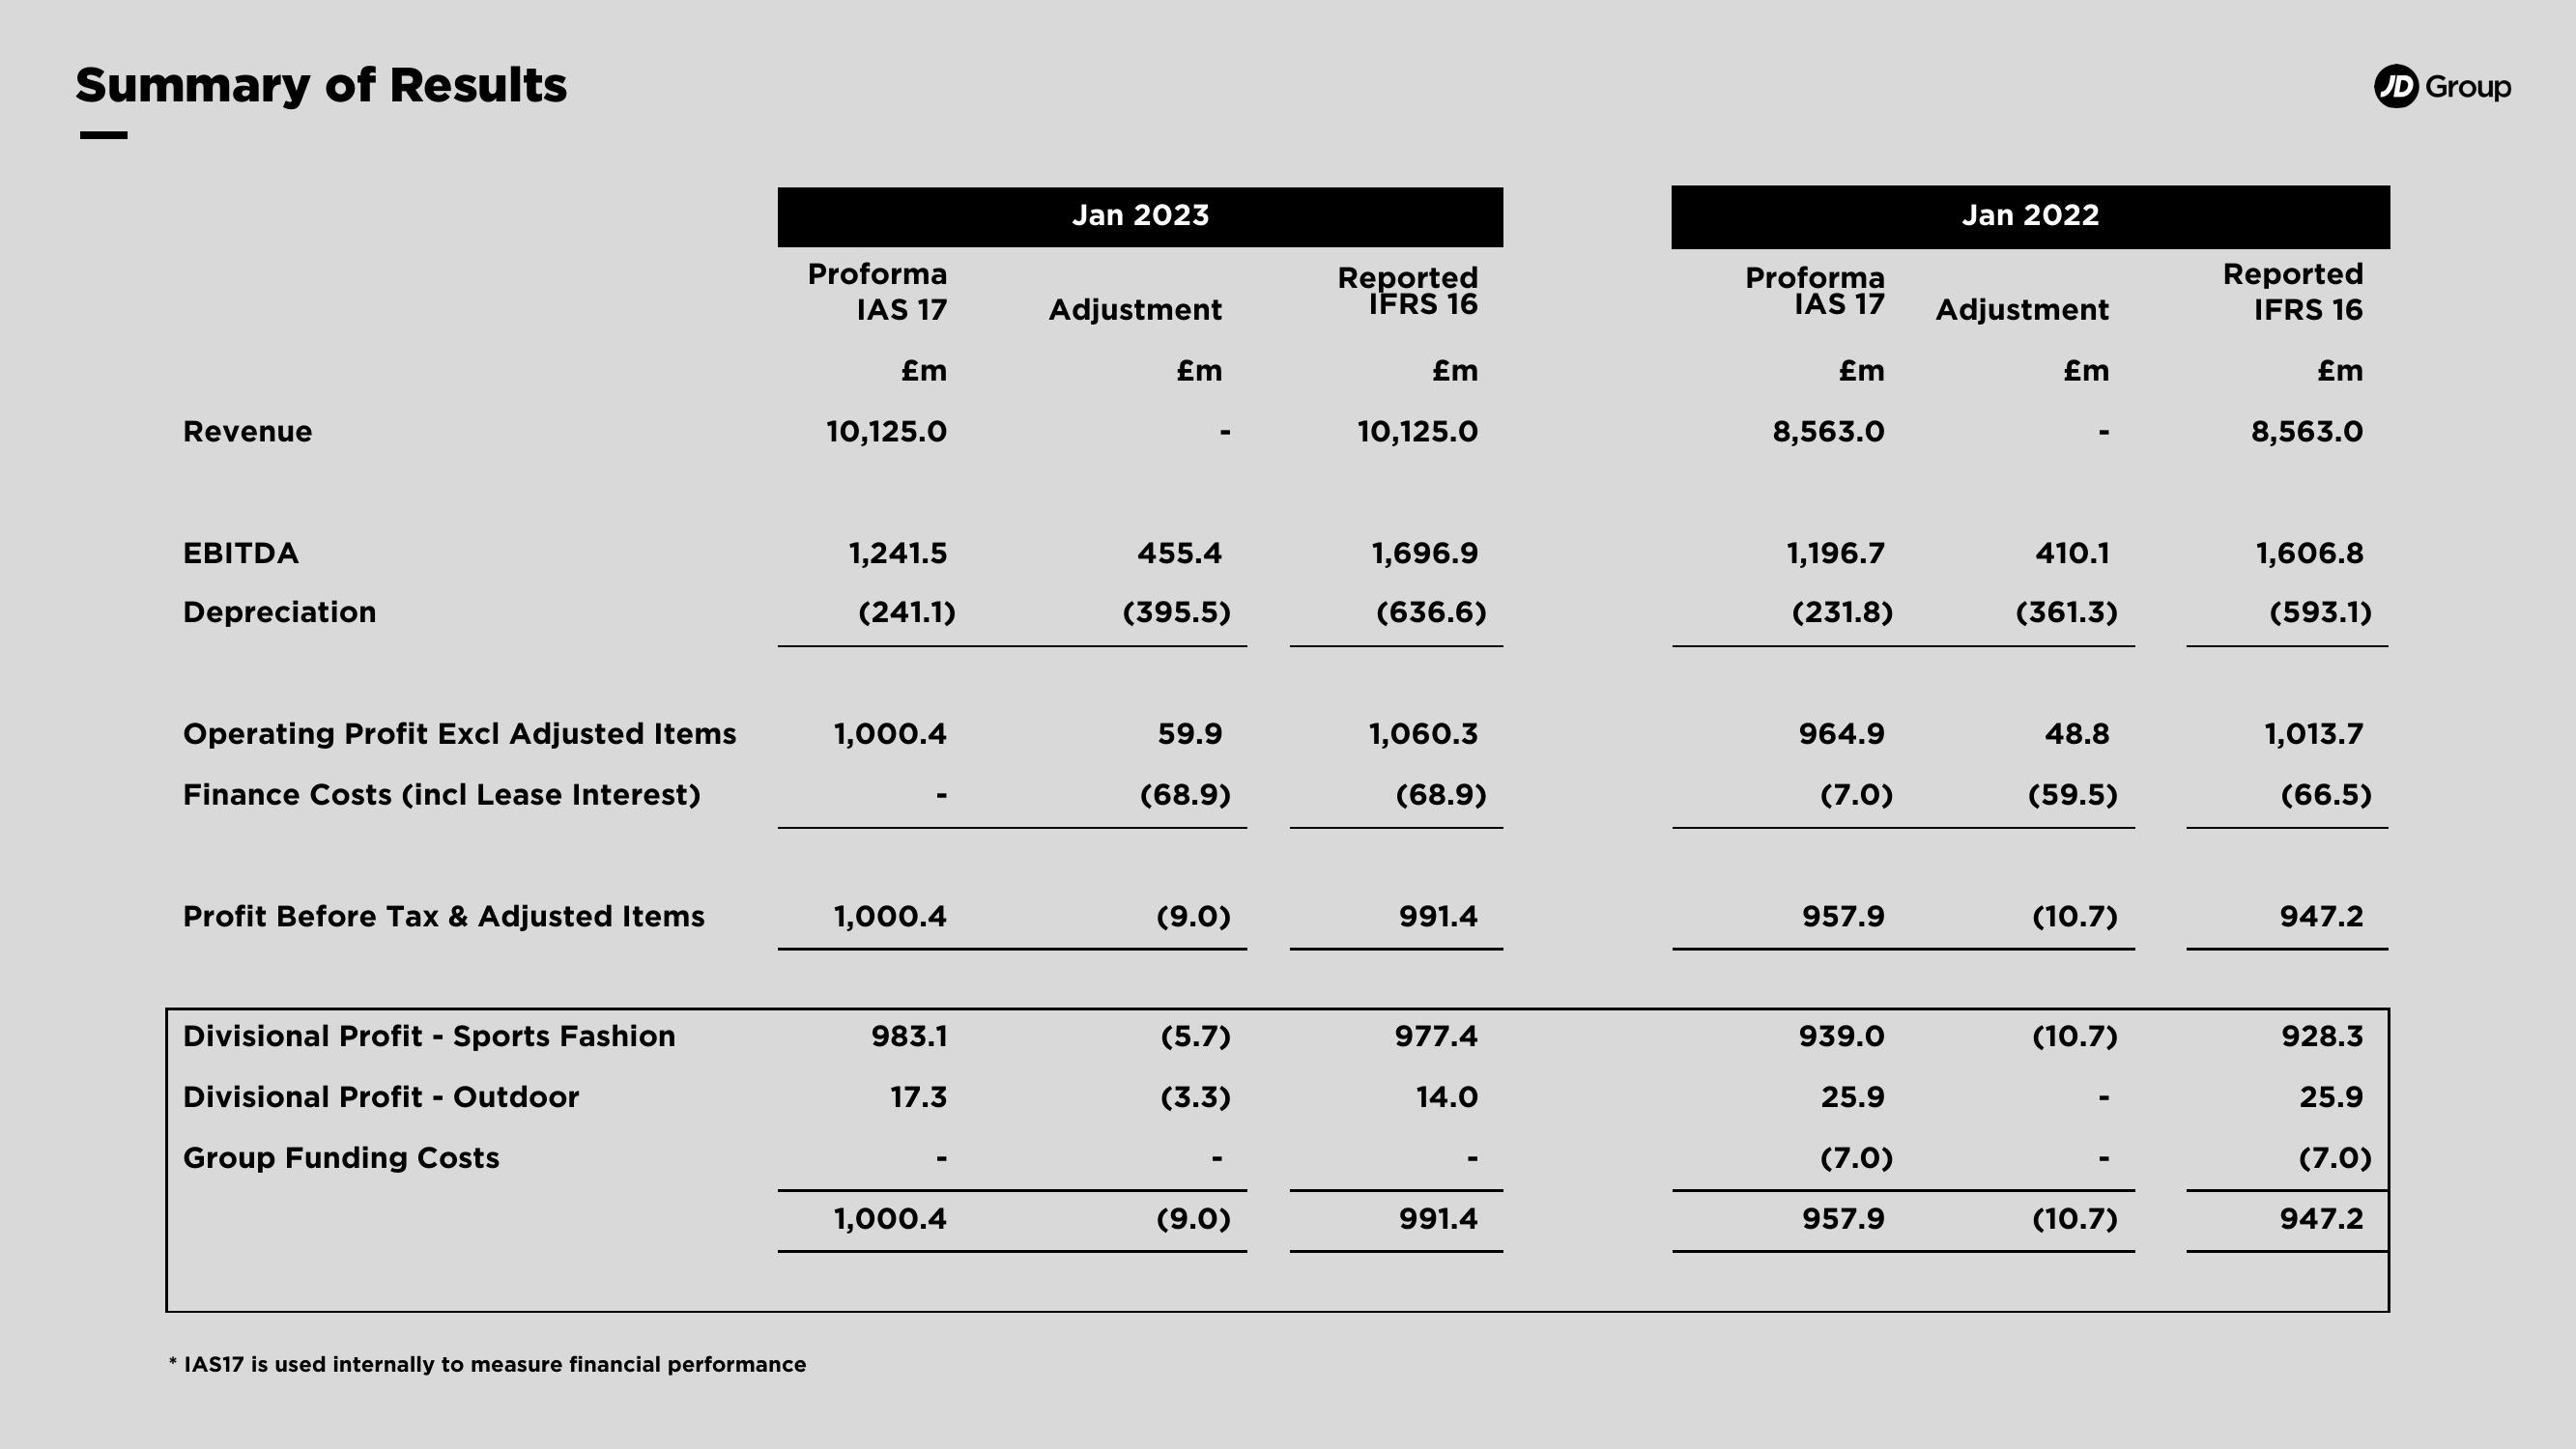
Summary of Results
Revenue
EBITDA
Depreciation
Operating Profit Excl Adjusted Items
Finance Costs (incl Lease Interest)
Profit Before Tax & Adjusted Items
Divisional Profit - Sports Fashion
Divisional Profit - Outdoor
Group Funding Costs
* IAS17 is used internally to measure financial performance
Proforma
IAS 17
£m
10,125.0
1,241.5
(241.1)
1,000.4
1,000.4
983.1
17.3
1,000.4
Jan 2023
Adjustment
£m
455.4
(395.5)
59.9
(68.9)
(9.0)
(5.7)
(3.3)
(9.0)
Reported
IFRS 16
£m
10,125.0
1,696.9
(636.6)
1,060.3
(68.9)
991.4
977.4
14.0
991.4
Proforma
IAS 17
£m
8,563.0
1,196.7
(231.8)
964.9
(7.0)
957.9
939.0
25.9
(7.0)
957.9
Jan 2022
Adjustment
£m
410.1
(361.3)
48.8
(59.5)
(10.7)
(10.7)
(10.7)
Reported
IFRS 16
£m
8,563.0
1,606.8
(593.1)
1,013.7
(66.5)
947.2
928.3
25.9
(7.0)
947.2
JD GroupView entire presentation