Apollo Global Management Investor Day Presentation Deck
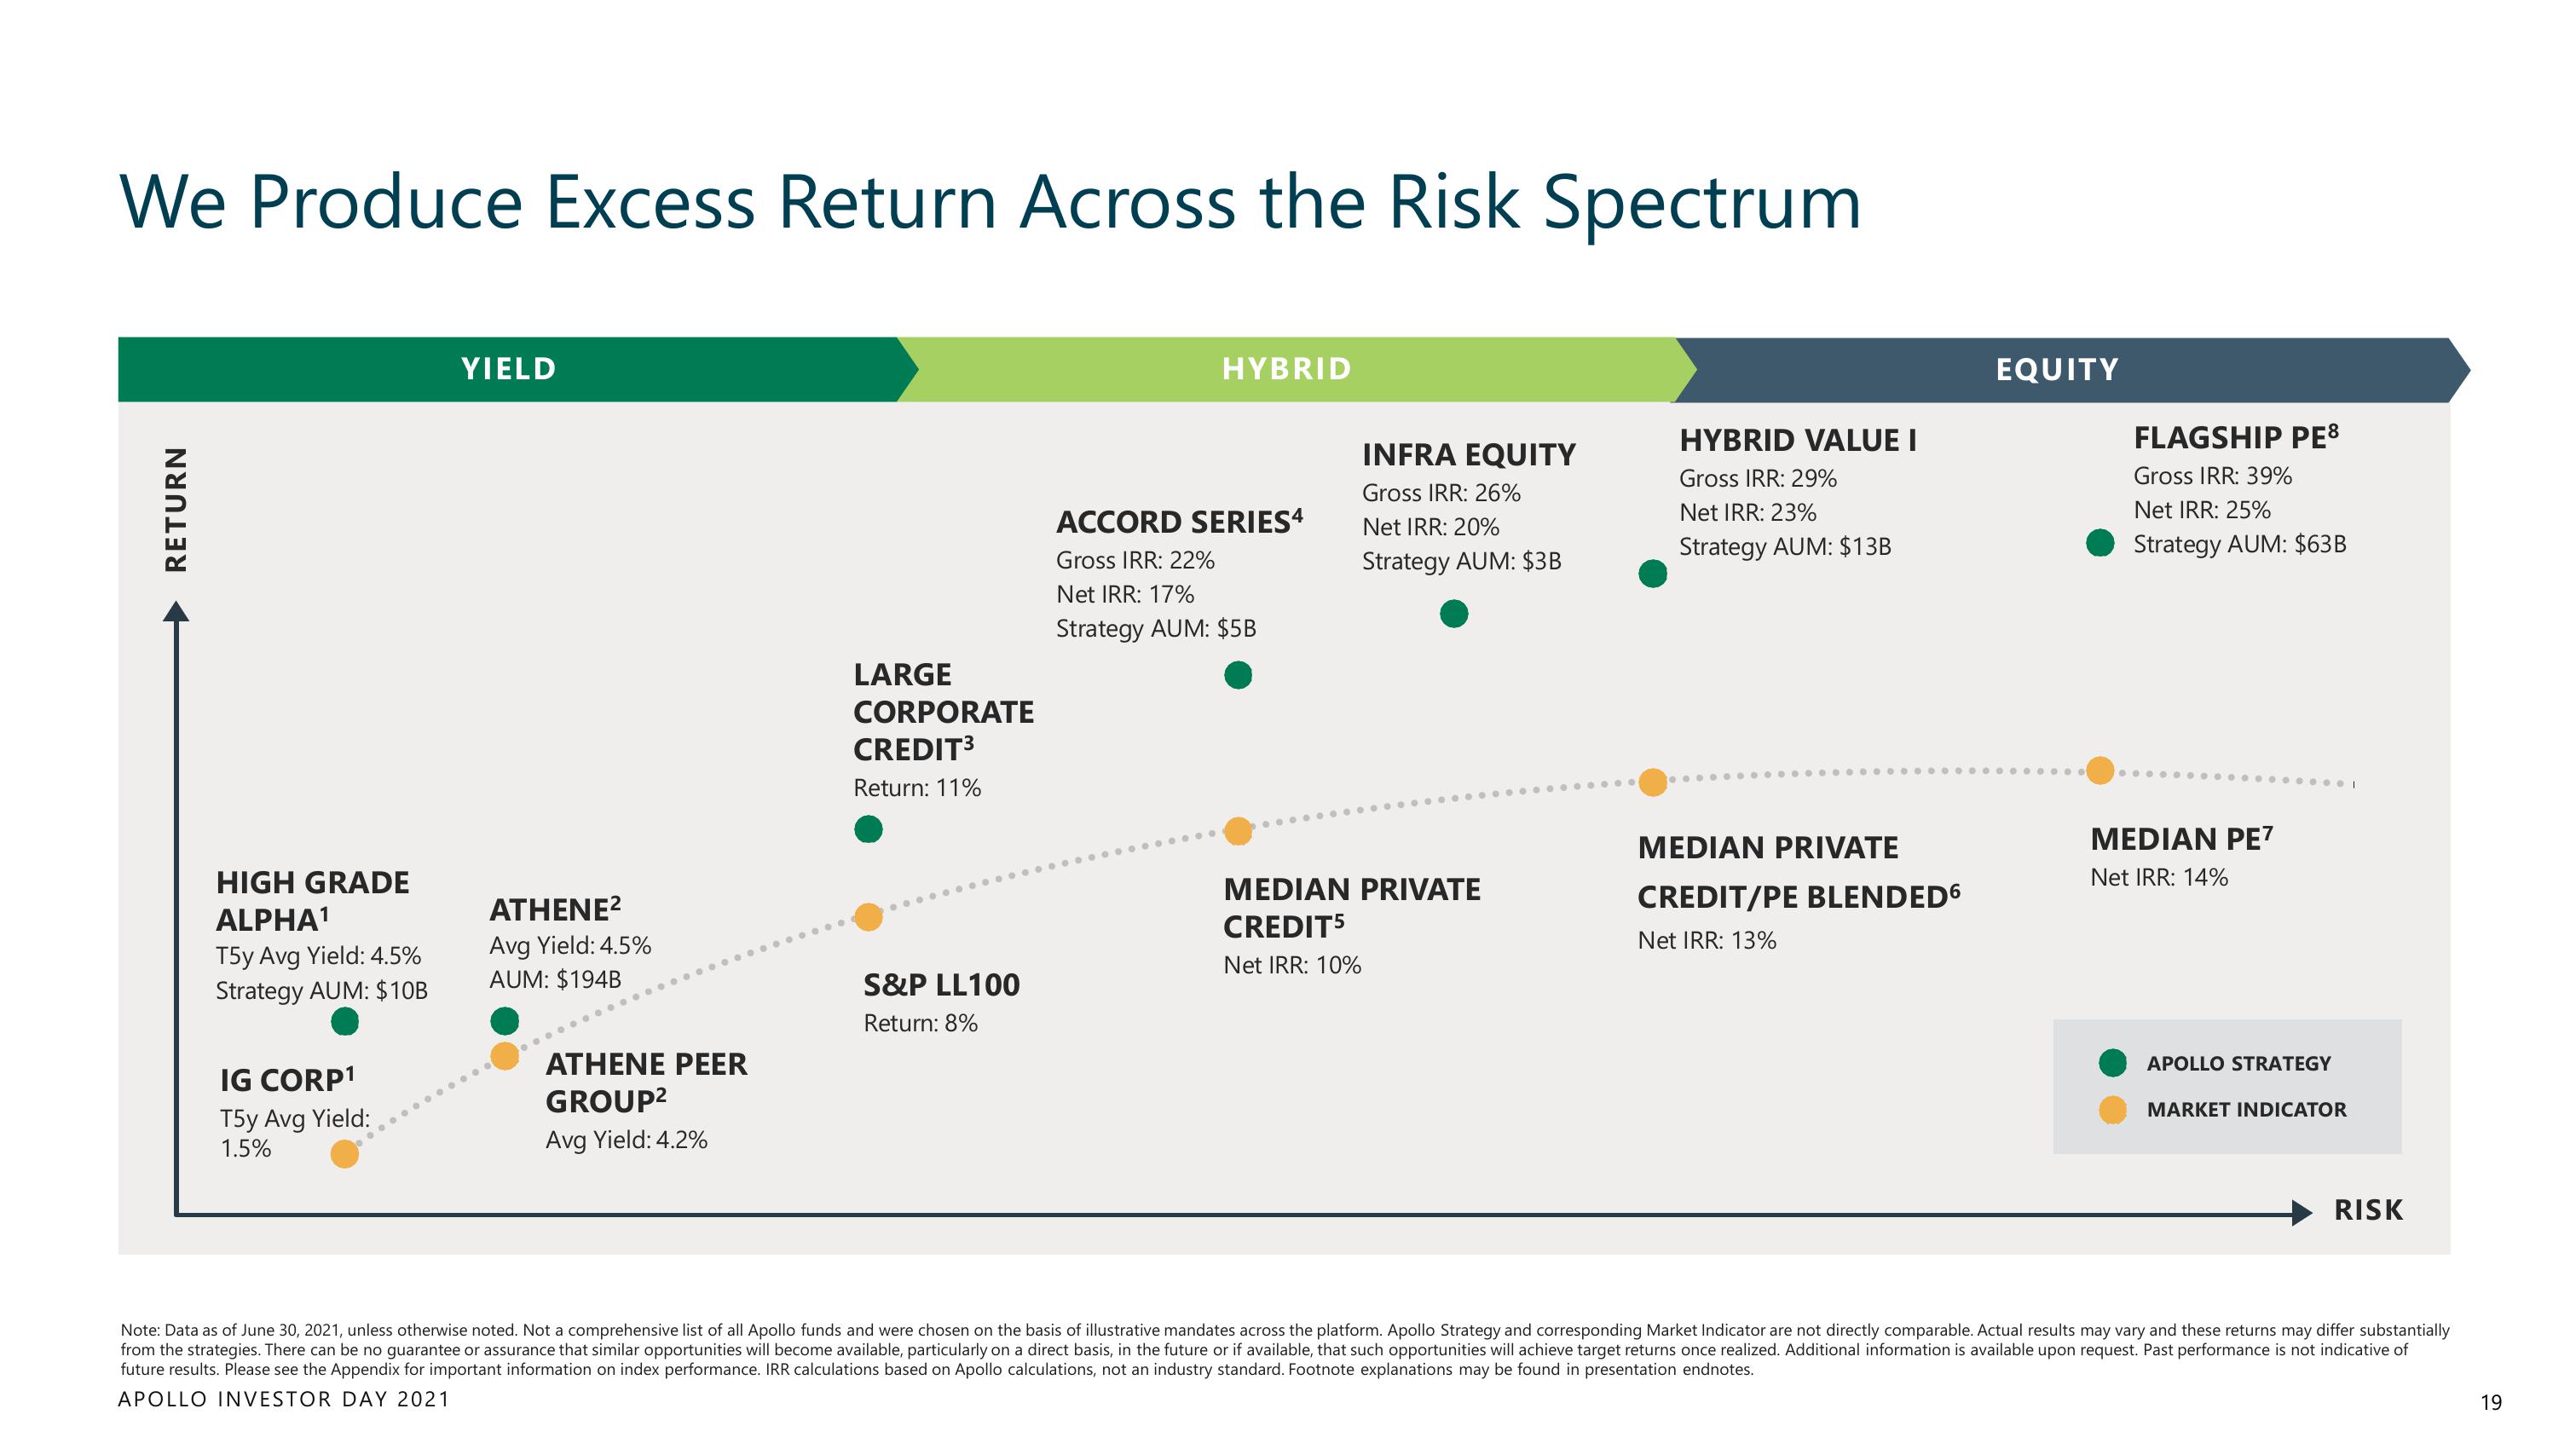
We Produce Excess Return Across the Risk Spectrum
RETURN
HIGH GRADE
ALPHA¹
T5y Avg Yield: 4.5%
Strategy AUM: $10B
IG CORP1
T5y Avg Yield:
1.5%
YIELD
ATHENE²
Avg Yield: 4.5%
AUM: $194B
ATHENE PEER
GROUP²
Avg Yield: 4.2%
LARGE
CORPORATE
CREDIT³
Return: 11%
S&P LL100
Return: 8%
HYBRID
ACCORD SERIES4
Gross IRR: 22%
Net IRR: 17%
Strategy AUM: $5B
INFRA EQUITY
Gross IRR: 26%
Net IRR: 20%
Strategy AUM: $3B
MEDIAN PRIVATE
CREDIT5
Net IRR: 10%
HYBRID VALUE I
Gross IRR: 29%
Net IRR: 23%
Strategy AUM: $13B
MEDIAN PRIVATE
CREDIT/PE BLENDED6
Net IRR: 13%
EQUITY
.........
FLAGSHIP PE8
Gross IRR: 39%
Net IRR: 25%
Strategy AUM: $63B
MEDIAN PE7
Net IRR: 14%
APOLLO STRATEGY
MARKET INDICATOR
RISK
Note: Data as of June 30, 2021, unless otherwise noted. Not a comprehensive list of all Apollo funds and were chosen on the basis of illustrative mandates across the platform. Apollo Strategy and corresponding Market Indicator are not directly comparable. Actual results may vary and these returns may differ substantially
from the strategies. There can be no guarantee or assurance that similar opportunities will become available, particularly on a direct basis, in the future or if available, that such opportunities will achieve target returns once realized. Additional information is available upon request. Past performance is not indicative of
future results. Please see the Appendix for important information on index performance. IRR calculations based on Apollo calculations, not an industry standard. Footnote explanations may be found in presentation endnotes.
APOLLO INVESTOR DAY 2021
19View entire presentation