Broadridge Financial Solutions Results Presentation Deck
20
00.00
0.0.
2008
D
a
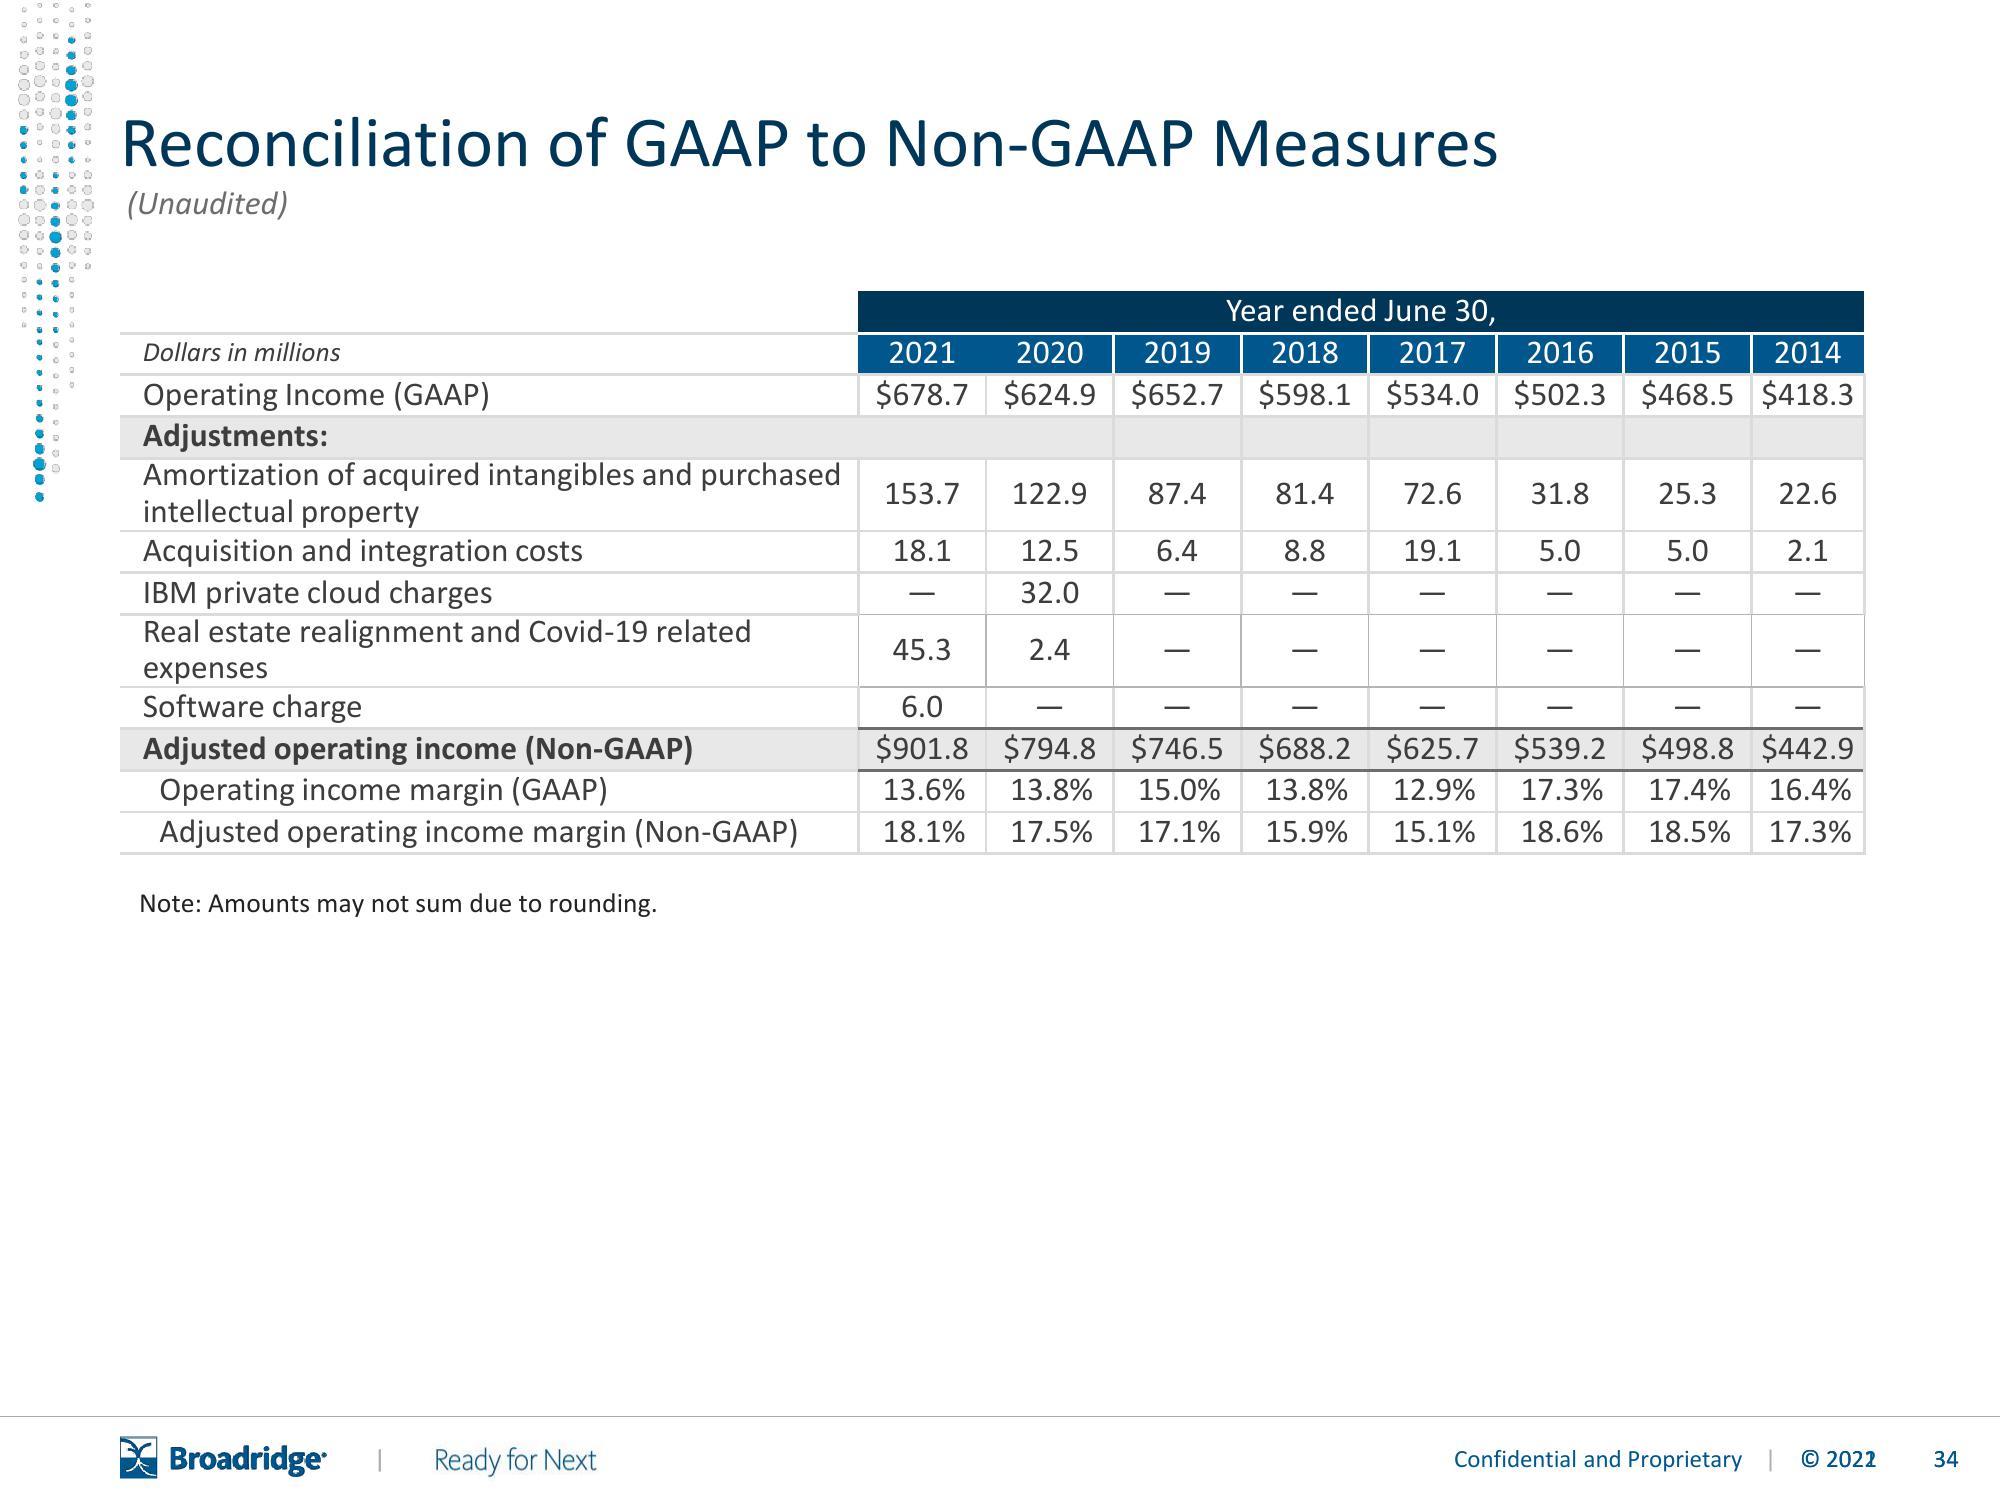
Reconciliation of GAAP to Non-GAAP Measures
(Unaudited)
Dollars in millions
Operating Income (GAAP)
Adjustments:
Amortization of acquired intangibles and purchased
intellectual property
Acquisition and integration costs
IBM private cloud charges
Real estate realignment and Covid-19 related
expenses
Software charge
Adjusted operating income (Non-GAAP)
Operating income margin (GAAP)
Adjusted operating income margin (Non-GAAP)
Note: Amounts may not sum due to rounding.
Broadridge I Ready for Next
2021
$678.7
153.7
18.1
Year ended June 30,
2020 2019 2018 2017 2016 2015 2014
$624.9 $652.7 $598.1 $534.0 $502.3 $468.5 $418.3
122.9 87.4
12.5
6.4
32.0
2.4
81.4
8.8
72.6
19.1
31.8 25.3
5.0
5.0
I
45.3
6.0
$901.8 $794.8 $746.5 $688.2 $625.7 $539.2 $498.8 $442.9
13.8% 15.0% 13.8% 12.9% 17.3% 17.4% 16.4%
17.5% 17.1% 15.9% 15.1% 18.6% 18.5% 17.3%
13.6%
18.1%
I
22.6
2.1
Confidential and Proprietary
T
© 2022
34View entire presentation