Nexters Investor Presentation Deck
Key financial highlights (2/2)
$m
Total Costs and Expenses, Excluding D&A
+43%
Q4 2020 Q4 2021
39
99
$m
Selling and Marketing Expenses
+30%
51
262
FY 2020
166
+112%
+63%
FY 2020
555
FY 2021
270
$m
FY 2021
Adjusted Costs and Expenses (1) (2)
79
+26%
Q4 2020
$m
G&A Expenses
>100%
99
Q4 2021
Q4 2020
9
312
Q4 2021
+44%
FY 2020
>100%
Q4 2020 Q4 2021
14
Source: Company information
1) The Company defines Adjusted costs and expenses as the total of platform commissions, game operating costs, selling and marketing expenses and general and administrative expenses for the period as shown in the
Company's financial statements in accordance with IFRS, adjusted to exclude (i) share-based compensation expense, (ii) net change in deferred platform commission fees, (iii) impairment of non-current assets, (iv) any gains
and losses arising as result of business combinations and (v) certain non-cash or other special items that we do not consider indicative of our ongoing operating performance. Adjusted costs and expenses is a non-IFRS
financial measure and should not be construed as an alternative to total costs and expenses excluding depreciation and amortization as an indicator of operating performance as determined in accordance with IFRS
2) Excluded non-cash non-recurring share listing expense in the amount of $125 million resulting from the accounting for merger with Kismet Acquisition One Corp.
FY 2020
449
FY 2021
23
FY 2021
nexters
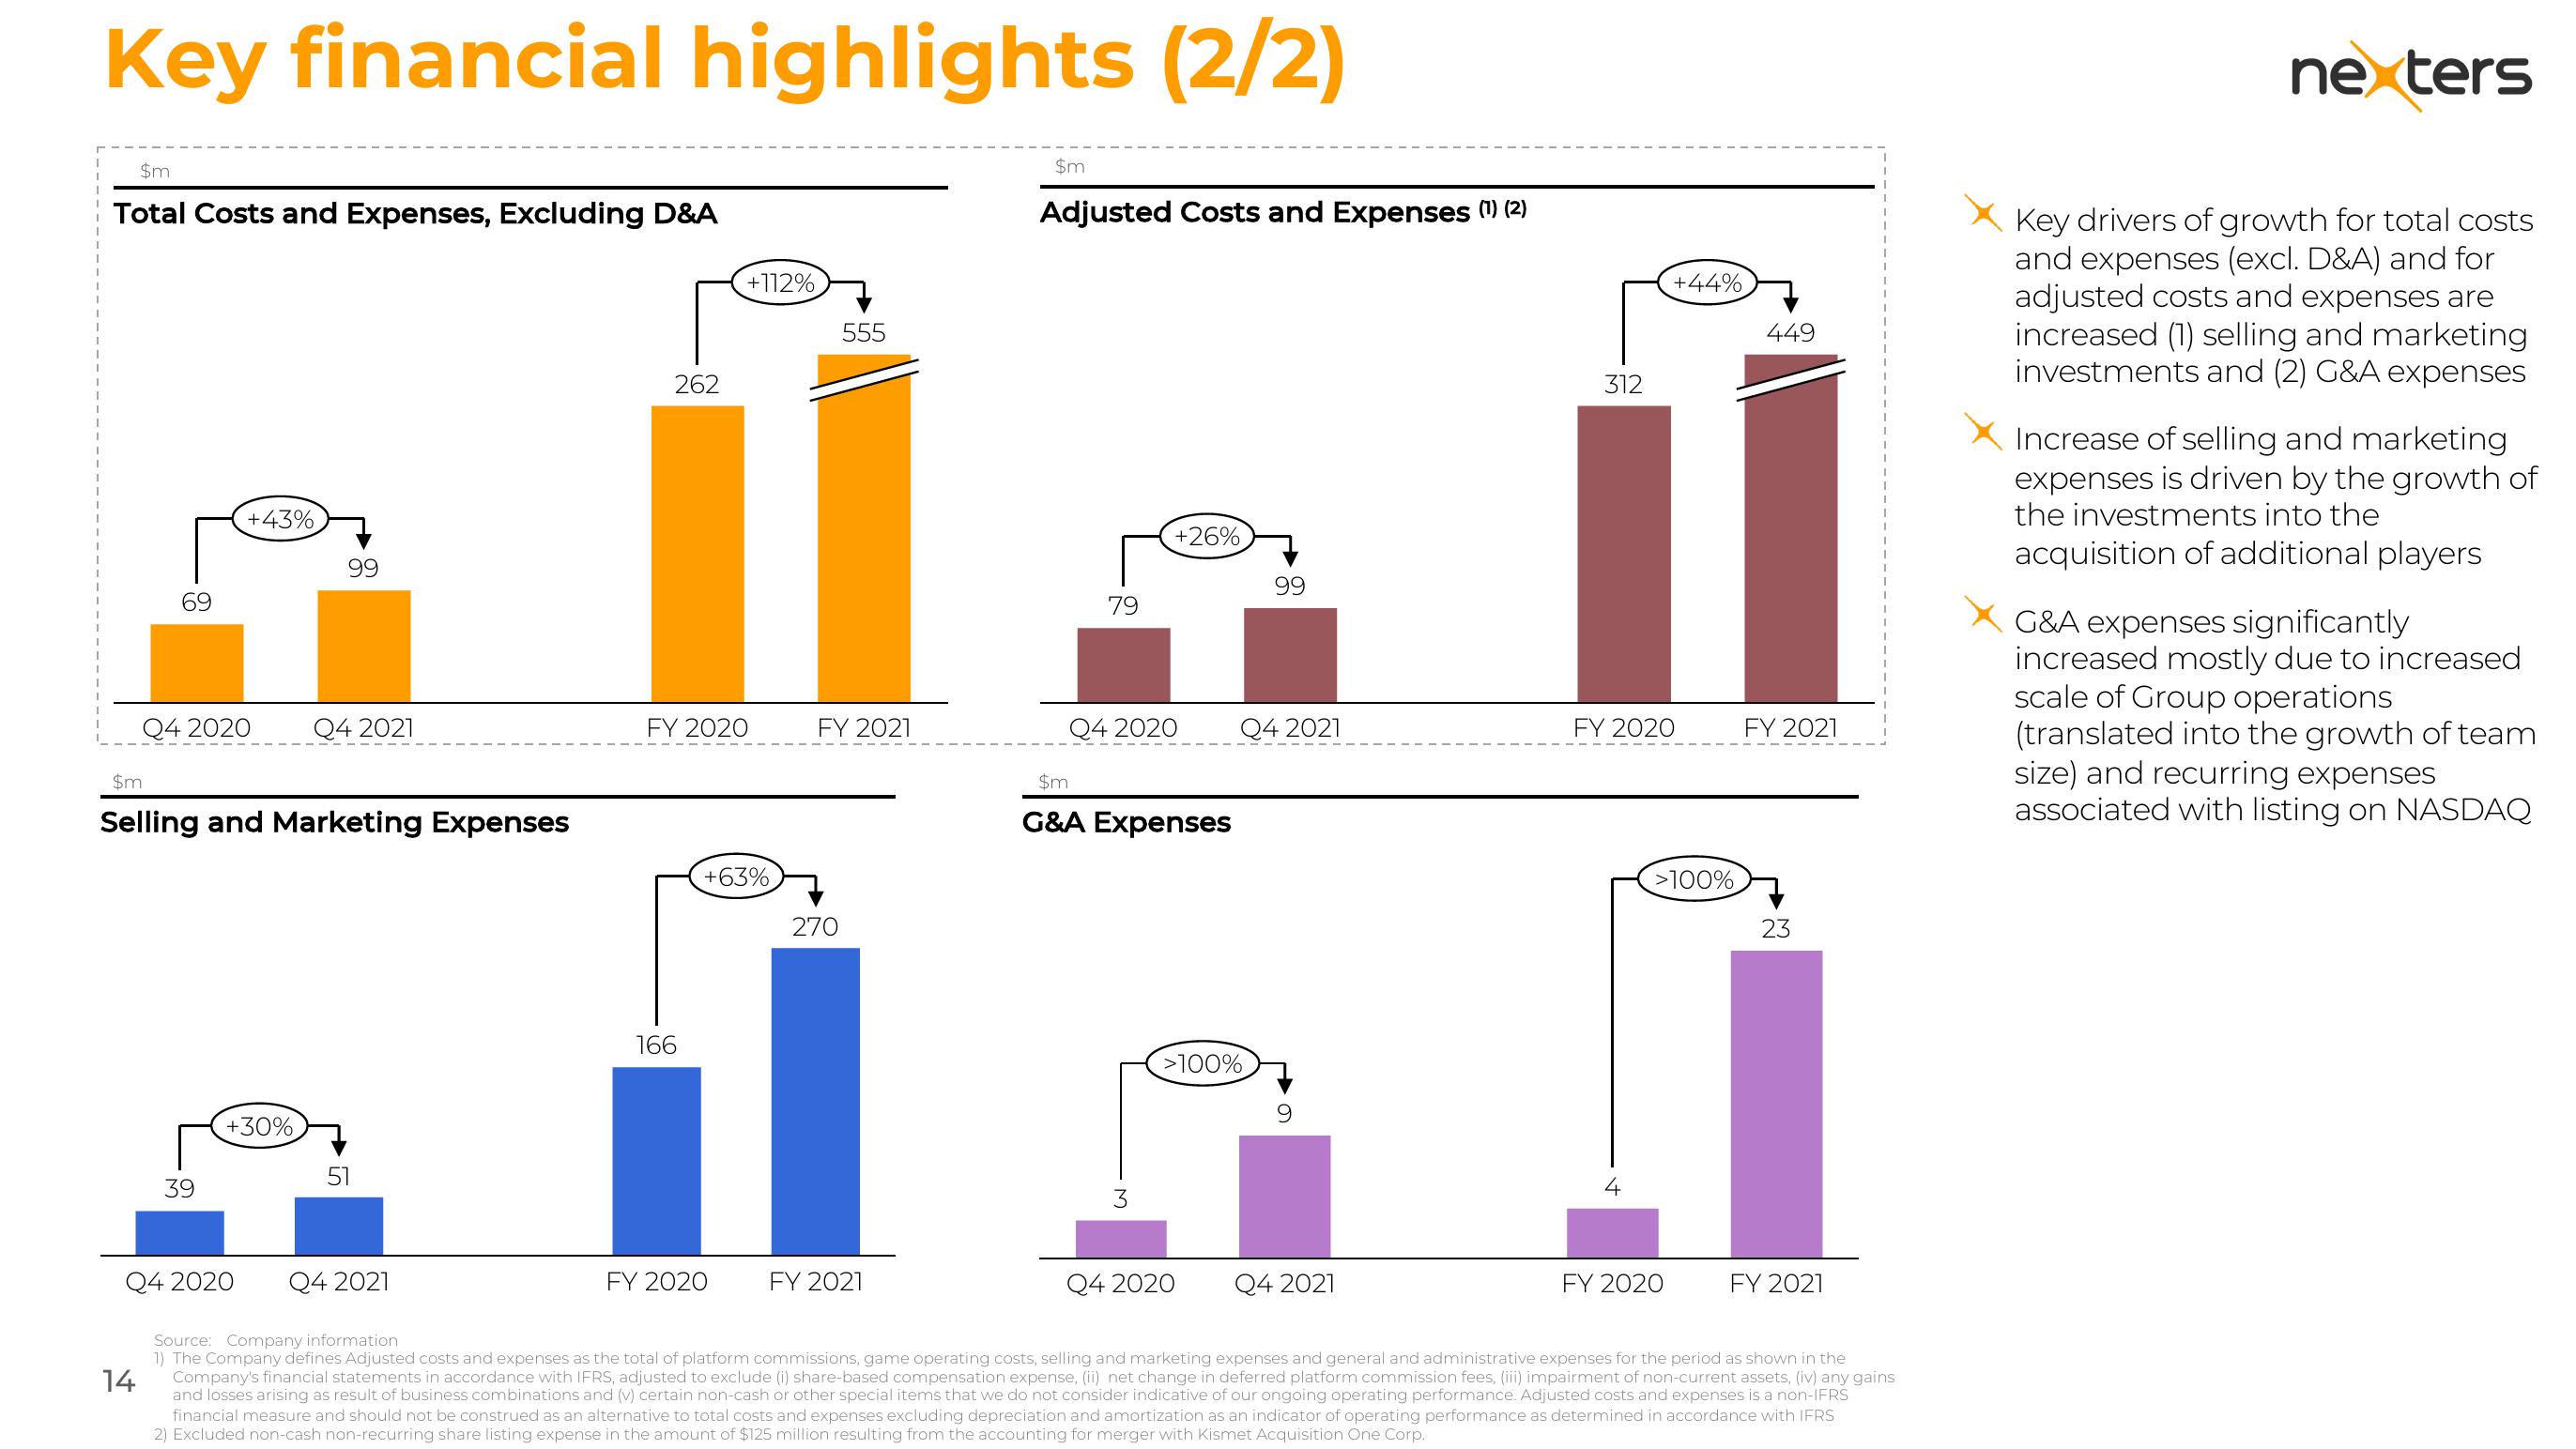
Key drivers of growth for total costs
and expenses (excl. D&A) and for
adjusted costs and expenses are
increased (1) selling and marketing
investments and (2) G&A expenses
Increase of selling and marketing
expenses is driven by the growth of
the investments into the
acquisition of additional players
G&A expenses significantly
increased mostly due to increased
scale of Group operations
(translated into the growth of team
size) and recurring expenses
associated with listing on NASDAQView entire presentation