Nexters Investor Presentation Deck
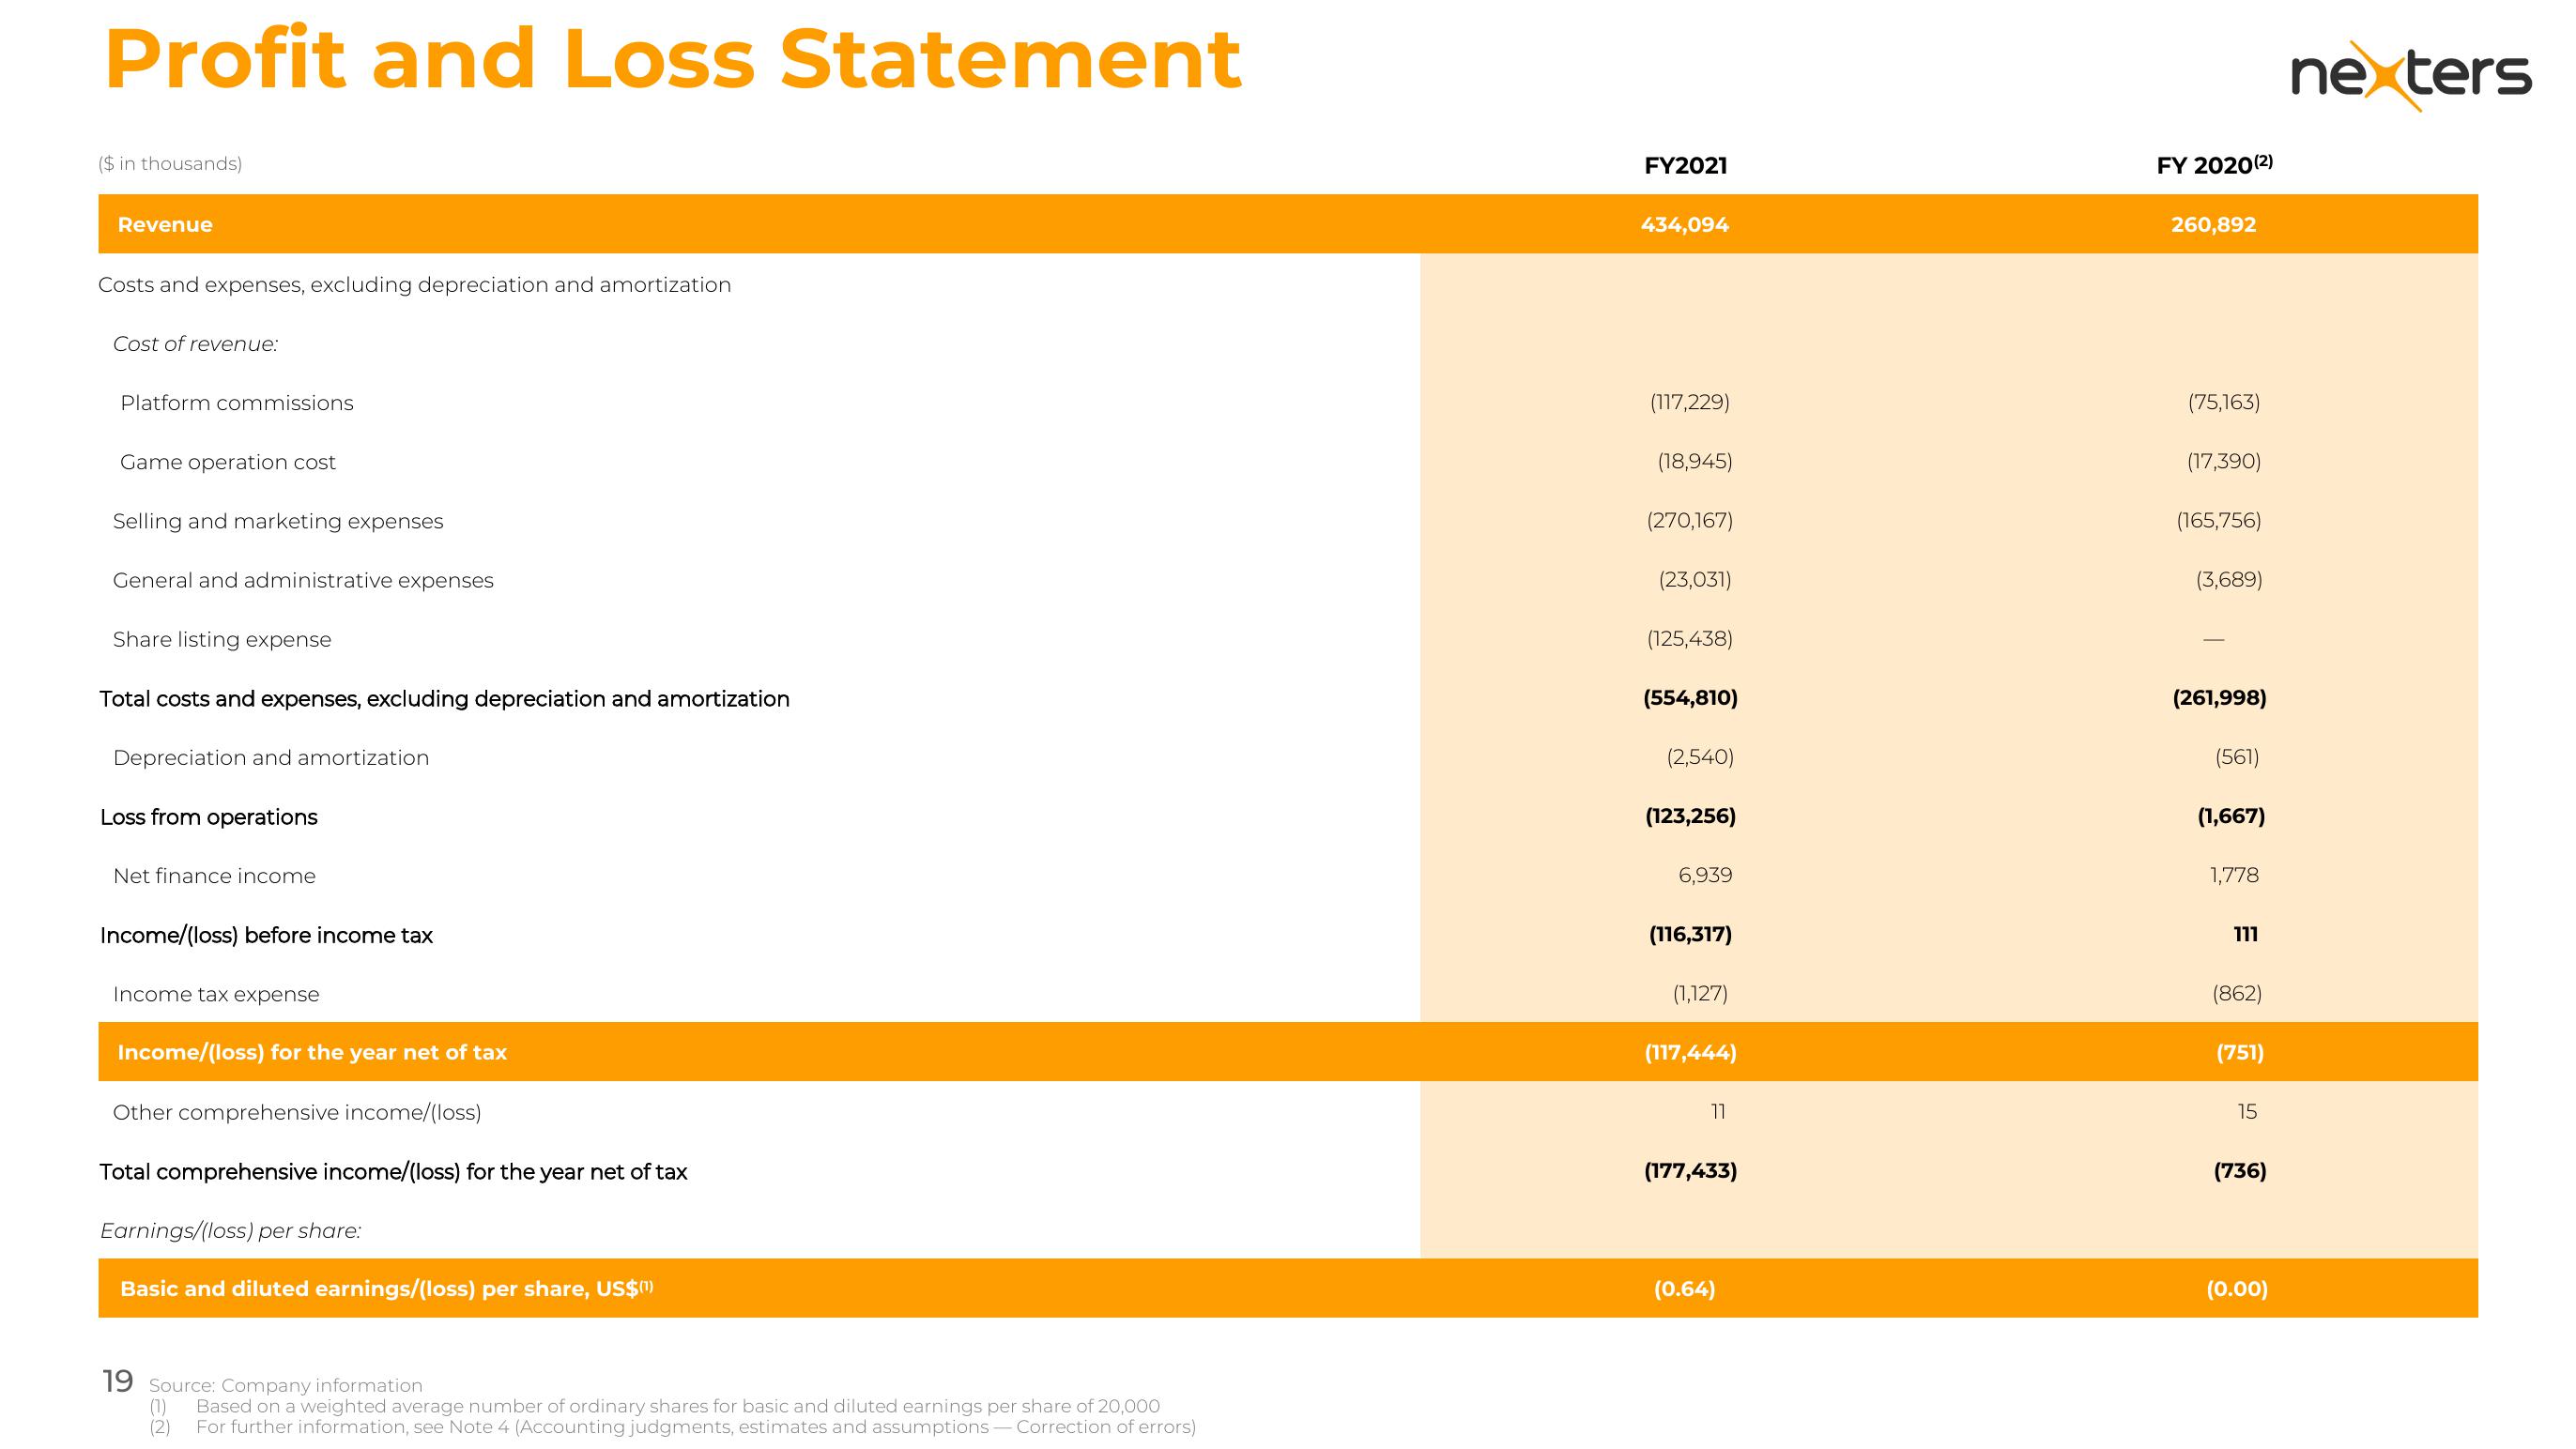
Profit and Loss Statement
($ in thousands)
Revenue
Costs and expenses, excluding depreciation and amortization
Cost of revenue:
Platform commissions
Game operation cost
Selling and marketing expenses
General and administrative expenses
Share listing expense
Total costs and expenses, excluding depreciation and amortization
Depreciation and amortization
Loss from operations
Net finance income
Income/(loss) before income tax
Income tax expense
Income/(loss) for the year net of tax
Other comprehensive income/(loss)
Total comprehensive income/(loss) for the year net of tax
Earnings/(loss) per share:
Basic and diluted earnings/(loss) per share, US$(¹)
19 Source: Company information
(1)
Based on a weighted average number of ordinary shares for basic and diluted earnings per share of 20,000
(2) For further information, see Note 4 (Accounting judgments, estimates and assumptions-Correction of errors)
FY2021
434,094
(117,229)
(18,945)
(270,167)
(23,031)
(125,438)
(554,810)
(2,540)
(123,256)
6,939
(116,317)
(1,127)
(117,444)
11
(177,433)
(0.64)
FY 2020(2)
260,892
(75,163)
(17,390)
(165,756)
(3,689)
(261,998)
(561)
(1,667)
1,778
111
(862)
(751)
15
(736)
(0.00)
nex tersView entire presentation