Apollo Global Management Investor Day Presentation Deck
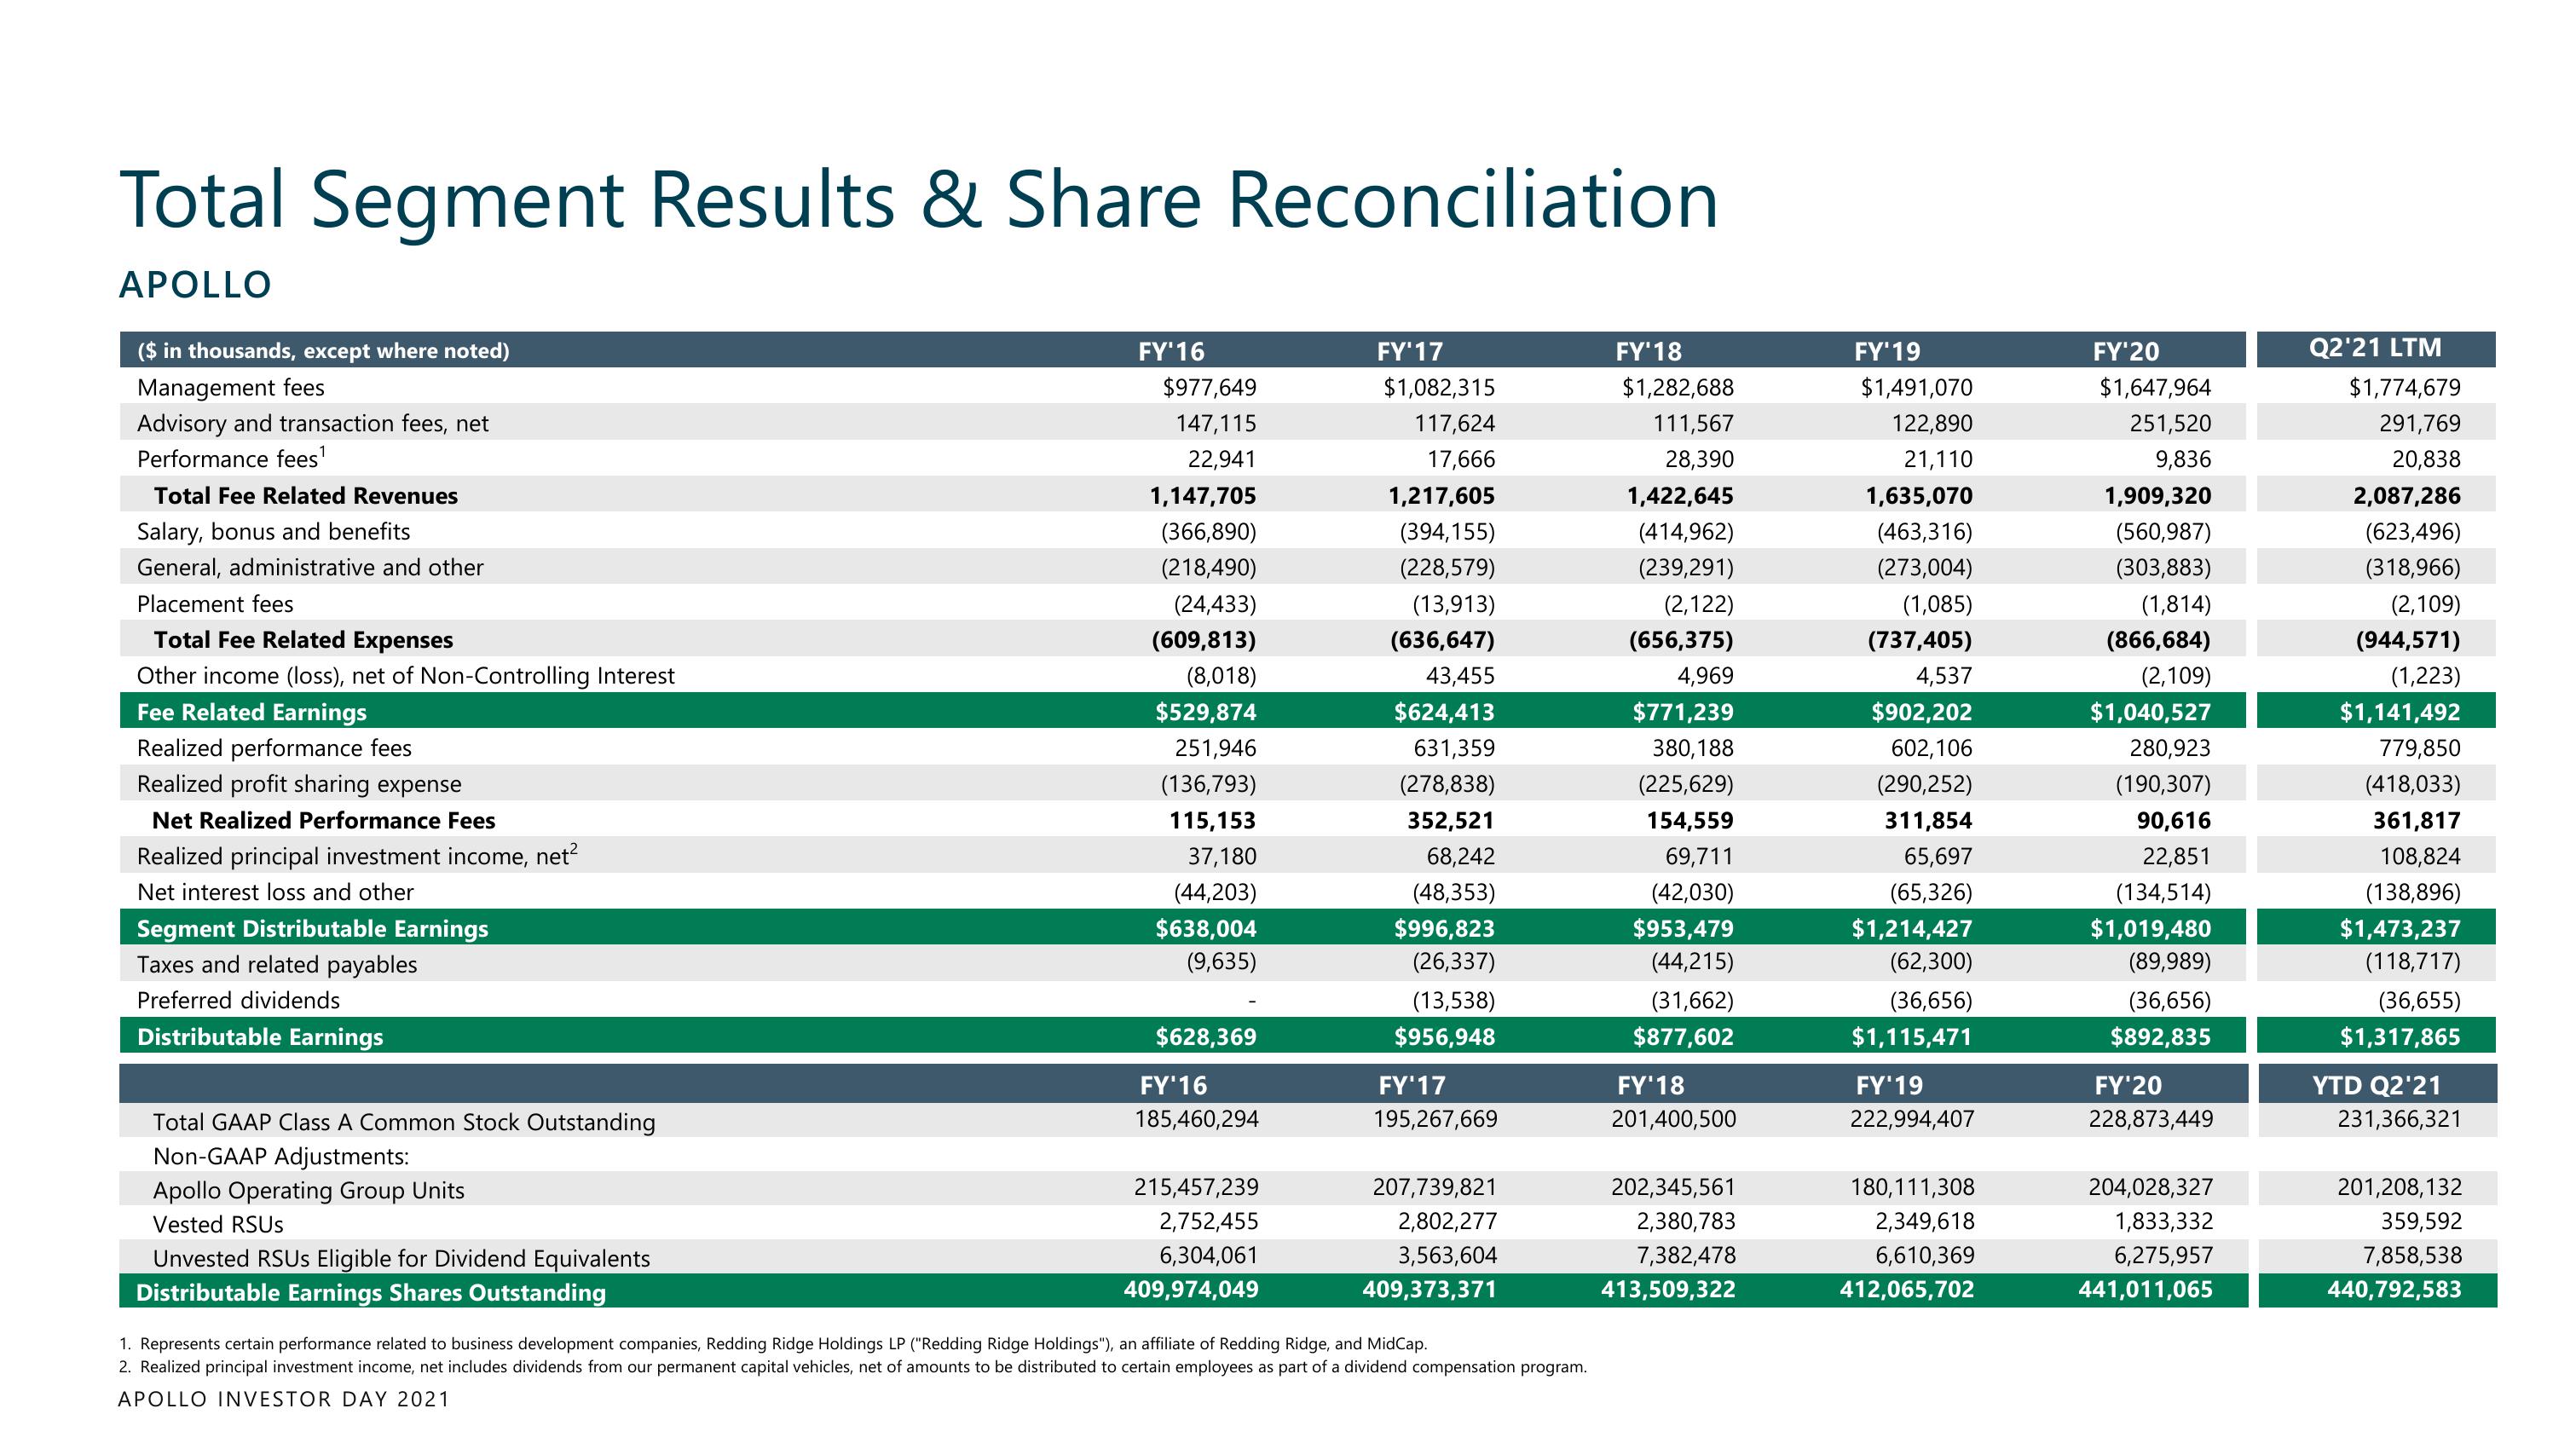
Total Segment Results & Share Reconciliation
APOLLO
($ in thousands, except where noted)
Management fees
Advisory and transaction fees, net
Performance fees¹
Total Fee Related Revenues
Salary, bonus and benefits
General, administrative and other
Placement fees
Total Fee Related Expenses
Other income (loss), net of Non-Controlling Interest
Fee Related Earnings
Realized performance fees
Realized profit sharing expense
Net Realized Performance Fees
Realized principal investment income, net²
Net interest loss and other
Segment Distributable Earnings
Taxes and related payables
Preferred dividends
Distributable Earnings
Total GAAP Class A Common Stock Outstanding
Non-GAAP Adjustments:
Apollo Operating Group Units
Vested RSUS
Unvested RSUS Eligible for Dividend Equivalents
Distributable Earnings Shares Outstanding
FY'16
$977,649
147,115
22,941
1,147,705
(366,890)
(218,490)
(24,433)
(609,813)
(8,018)
$529,874
251,946
(136,793)
115,153
37,180
(44,203)
$638,004
(9,635)
$628,369
FY'16
185,460,294
215,457,239
2,752,455
6,304,061
409,974,049
FY'17
$1,082,315
117,624
17,666
1,217,605
(394,155)
(228,579)
(13,913)
(636,647)
43,455
$624,413
631,359
(278,838)
352,521
68,242
(48,353)
$996,823
(26,337)
(13,538)
$956,948
FY'17
195,267,669
207,739,821
2,802,277
3,563,604
409,373,371
1. Represents certain performance related to business development companies, Redding Ridge Holdings LP ("Redding Ridge Holdings"), an affiliate of Redding Ridge, and MidCap.
2. Realized principal investment income, net includes dividends from our permanent capital vehicles, net of amounts to be distributed to certain employees as part of a dividend compensation program.
APOLLO INVESTOR DAY 2021
FY'18
$1,282,688
111,567
28,390
1,422,645
(414,962)
(239,291)
(2,122)
(656,375)
4,969
$771,239
380,188
(225,629)
154,559
69,711
(42,030)
$953,479
(44,215)
(31,662)
$877,602
FY'18
201,400,500
202,345,561
2,380,783
7,382,478
413,509,322
FY'19
$1,491,070
122,890
21,110
1,635,070
(463,316)
(273,004)
(1,085)
(737,405)
4,537
$902,202
602,106
(290,252)
311,854
65,697
(65,326)
$1,214,427
(62,300)
(36,656)
$1,115,471
FY'19
222,994,407
180,111,308
2,349,618
6,610,369
412,065,702
FY'20
$1,647,964
251,520
9,836
1,909,320
(560,987)
(303,883)
(1,814)
(866,684)
(2,109)
$1,040,527
280,923
(190,307)
90,616
22,851
(134,514)
$1,019,480
(89,989)
(36,656)
$892,835
FY'20
228,873,449
204,028,327
1,833,332
6,275,957
441,01 1,065
Q2'21 LTM
$1,774,679
291,769
20,838
2,087,286
(623,496)
(318,966)
(2,109)
(944,571)
(1,223)
$1,141,492
779,850
(418,033)
361,817
108,824
(138,896)
$1,473,237
(118,717)
(36,655)
$1,317,865
YTD Q2'21
231,366,321
201,208,132
359,592
7,858,538
440,792,583View entire presentation