Micro Focus Fixed Income Presentation Deck slide image

Micro Focus Fixed Income Presentation Deck

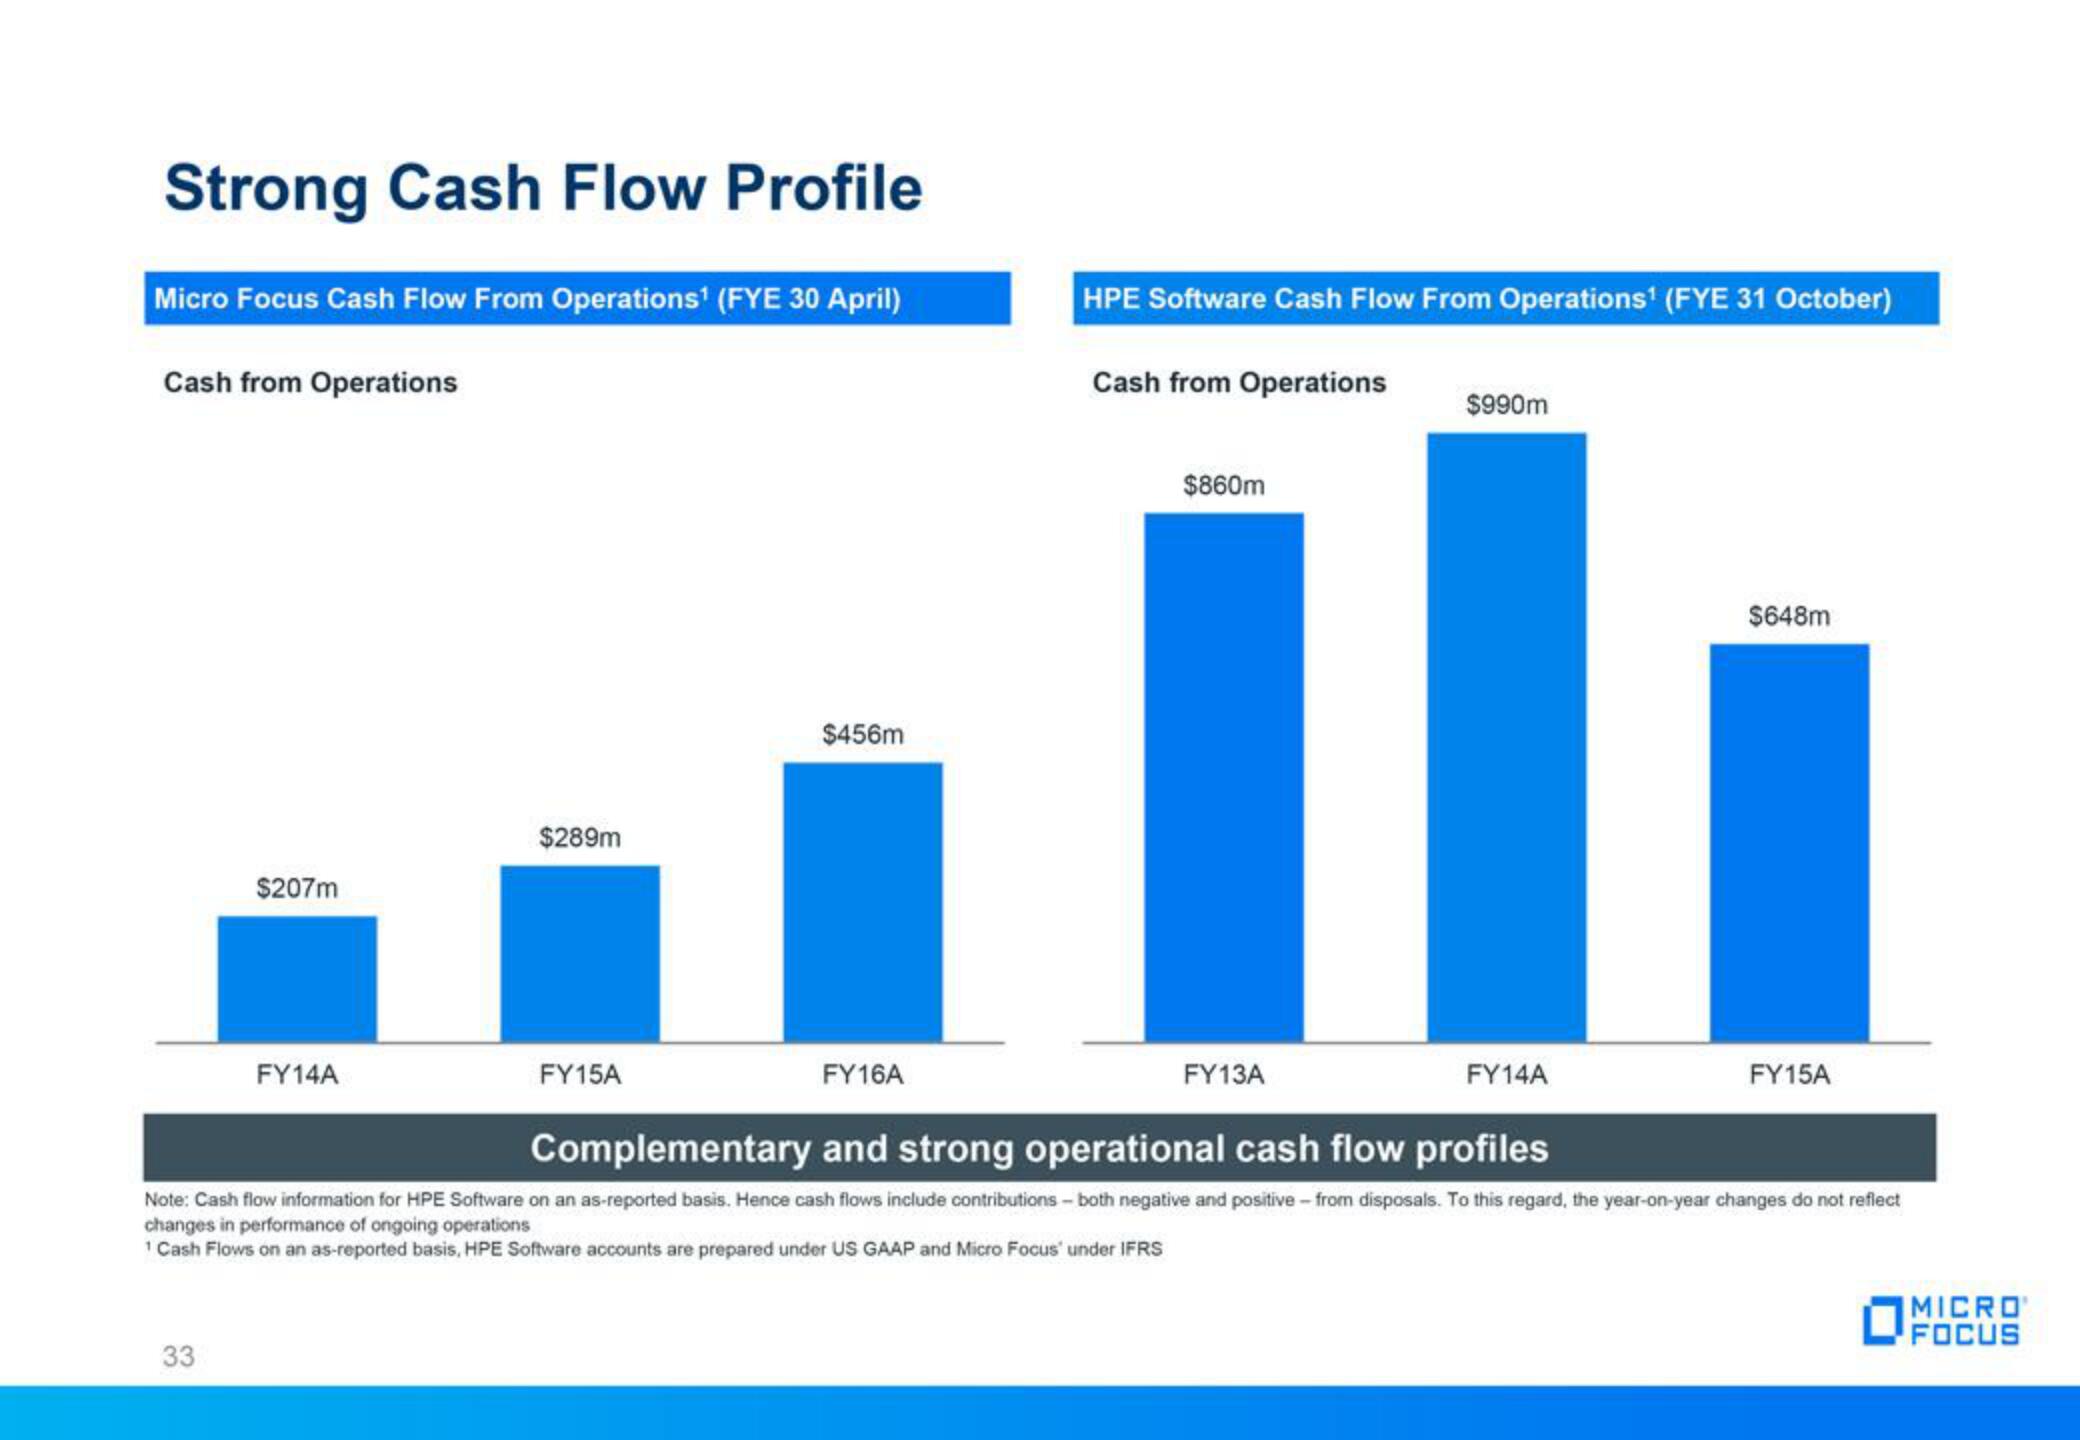
Strong Cash Flow Profile Micro Focus Cash Flow From Operations¹ (FYE 30 April) Cash from Operations $207m 33 $289m FY14A $456m FY15A HPE Software Cash Flow From Operations¹ (FYE 31 October) Cash from Operations $860m FY16A Complementary and strong operational cash flow profiles Note: Cash flow information for HPE Software on an as-reported basis. Hence cash flows include contributions - both negative and positive - from disposals. To this regard, the year-on-year changes do not reflect changes in performance of ongoing operations 1 Cash Flows on an as-reported basis, HPE Software accounts are prepared under US GAAP and Micro Focus' under IFRS $990m FY13A $648m FY14A FY15A MICRO FOCUS
View entire presentation