Broadridge Financial Solutions Results Presentation Deck
00
D
00.00
0.0.
Co
G
0
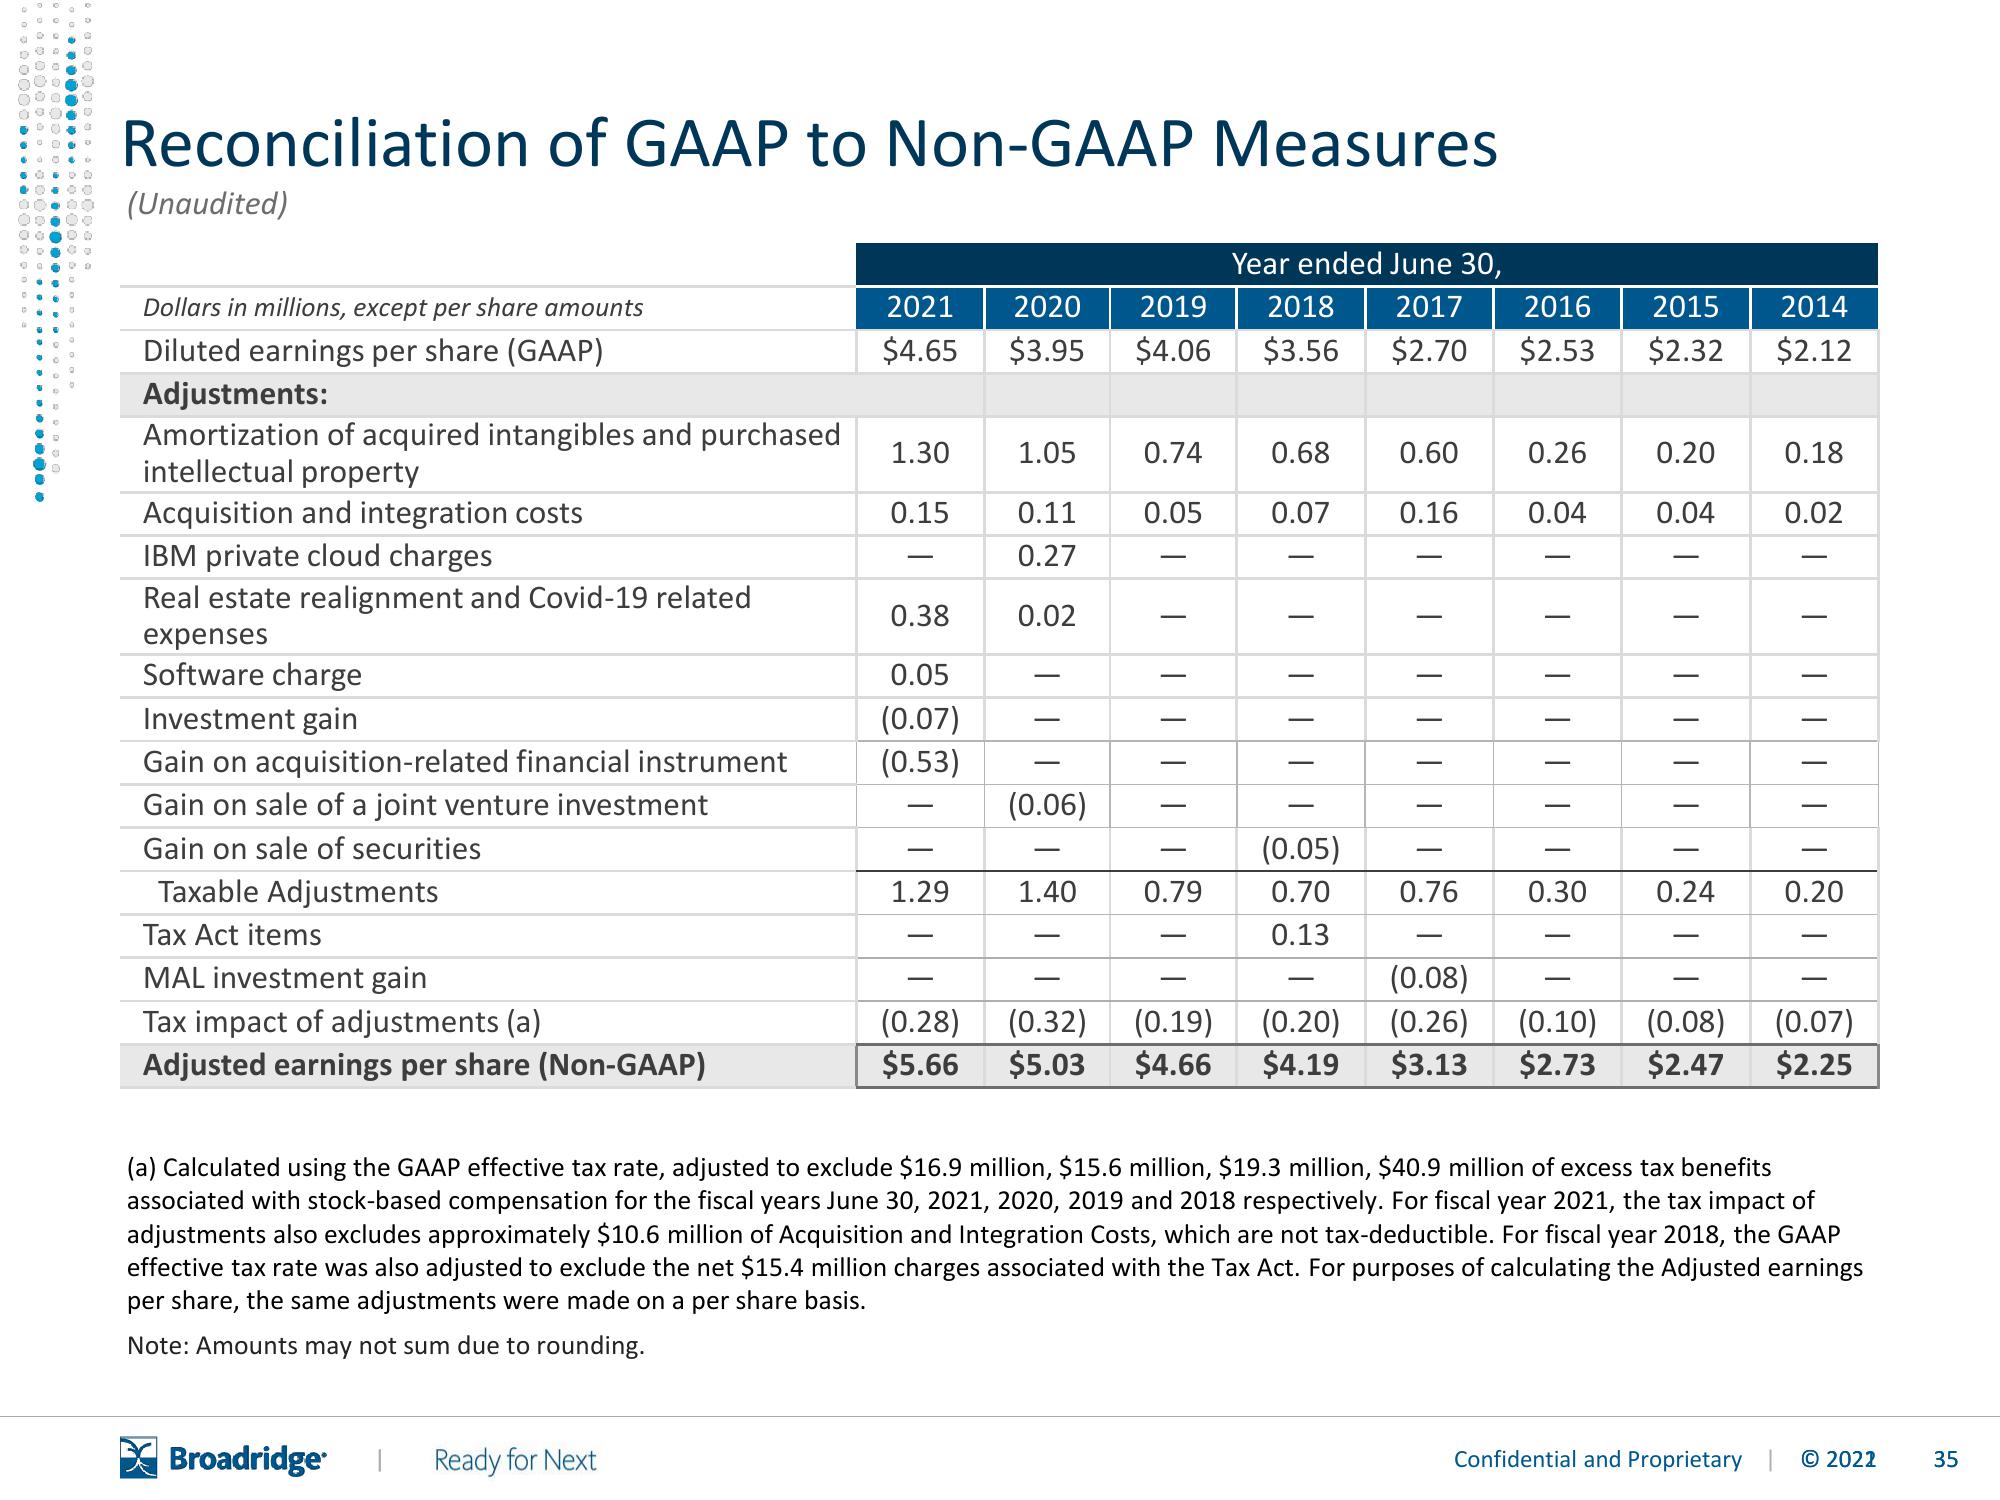
Reconciliation of GAAP to Non-GAAP Measures
(Unaudited)
Dollars in millions, except per share amounts
Diluted earnings per share (GAAP)
Adjustments:
Amortization of acquired intangibles and purchased
intellectual property
Acquisition and integration costs
IBM private cloud charges
Real estate realignment and Covid-19 related
expenses
Software charge
Investment gain
Gain on acquisition-related financial instrument
Gain on sale of a joint venture investment
Gain on sale of securities
Taxable Adjustments
Tax Act items
MAL investment gain
Tax impact of adjustments (a)
Adjusted earnings per share (Non-GAAP)
Broadridge
2021
$4.65 $3.95
Ready for Next
1.30
0.15
0.38
0.05
(0.07)
(0.53)
||N
2020 2019
$4.06
1.29
1.05
0.11
0.27
0.02
(0.06)
0.74
0.05
||||||
1.40 0.79
Year ended June 30,
2018 2017 2016
$3.56
0.68
0.07
|||||
2015
$2.70 $2.53 $2.32
0.60
0.16
|||||
(0.05)
0.70 0.76
0.13
0.26
0.04
|||||||
0.30
0.20
0.04
|||||||
0.24
(0.08)
(0.28) (0.32) (0.19) (0.20) (0.26) (0.10) (0.08)
$5.66 $5.03 $4.66 $4.19 $3.13 $2.73 $2.47
-
2014
$2.12
Confidential and Proprietary
0.18
0.02
T
|||||
(a) Calculated using the GAAP effective tax rate, adjusted to exclude $16.9 million, $15.6 million, $19.3 million, $40.9 million of excess tax benefits
associated with stock-based compensation for the fiscal years June 30, 2021, 2020, 2019 and 2018 respectively. For fiscal year 2021, the tax impact of
adjustments also excludes approximately $10.6 million of Acquisition and Integration Costs, which are not tax-deductible. For fiscal year 2018, the GAAP
effective tax rate was also adjusted to exclude the net $15.4 million charges associated with the Tax Act. For purposes of calculating the Adjusted earnings
per share, the same adjustments were made on a per share basis.
Note: Amounts may not sum due to rounding.
0.20
(0.07)
$2.25
© 2022
35View entire presentation