KLA Investor Day Presentation Deck
■
■
I
■
Strong Financial Performance
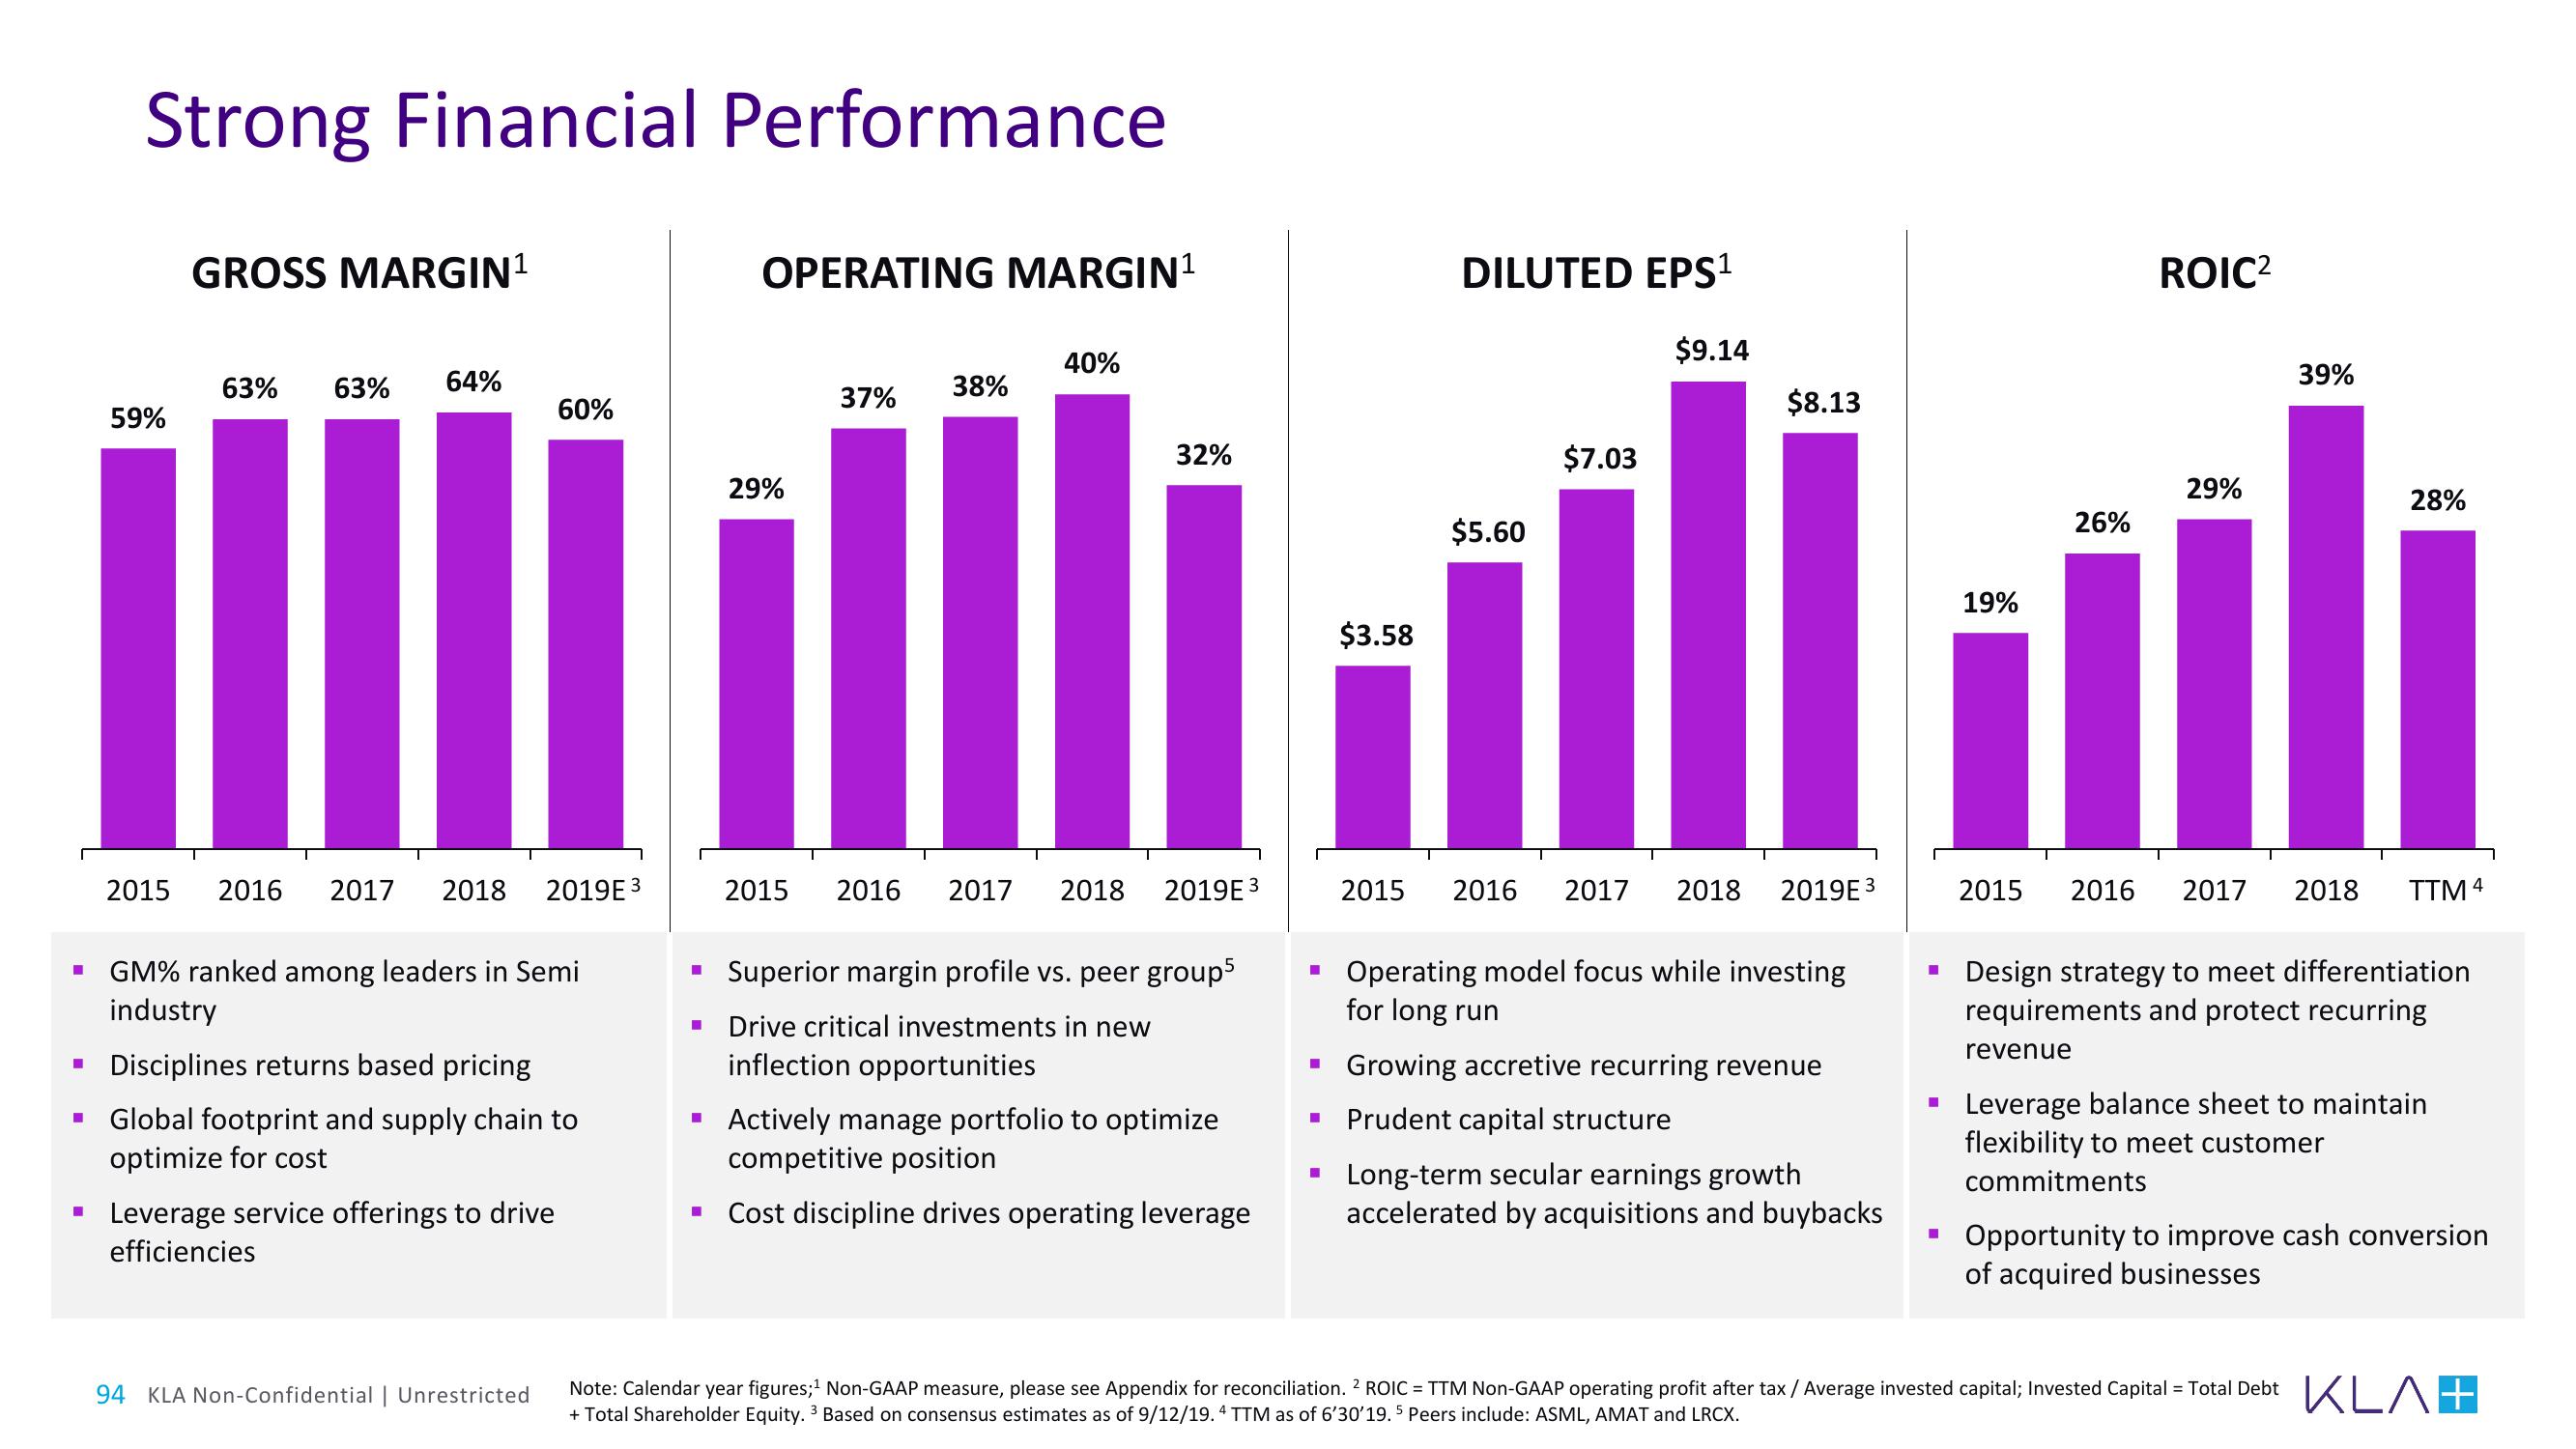
59%
GROSS MARGIN¹
63%
63% 64%
2015 2016 2017 2018
60%
2019E3
GM% ranked among leaders in Semi
industry
Disciplines returns based pricing
Global footprint and supply chain to
optimize for cost
Leverage service offerings to drive
efficiencies
94 KLA Non-Confidential | Unrestricted
■
■
OPERATING MARGIN¹
■
29%
37%
38%
40%
Superior margin profile vs. peer group5
■ Drive critical investments in new
inflection opportunities
32%
2015 2016 2017 2018 2019E3
Actively manage portfolio to optimize
competitive position
Cost discipline drives operating leverage
■
■
$3.58
■
2015
DILUTED EPS¹
$5.60
$7.03
$9.14
2016 2017 2018
$8.13
2019E3
Growing accretive recurring revenue
▪ Prudent capital structure
Operating model focus while investing
for long run
Long-term secular earnings growth
accelerated by acquisitions and buybacks
I
■
19%
26%
ROIC²
revenue
29%
2015 2016 2017 2018
39%
28%
Design strategy to meet differentiation
requirements and protect recurring
TTM 4
Note: Calendar year figures;¹ Non-GAAP measure, please see Appendix for reconciliation. 2 ROIC = TTM Non-GAAP operating profit after tax / Average invested capital; Invested Capital = Total Debt
+ Total Shareholder Equity. 3 Based on consensus estimates as of 9/12/19.4 TTM as of 6'30'19. 5 Peers include: ASML, AMAT and LRCX.
Leverage balance sheet to maintain
flexibility to meet customer
commitments
Opportunity to improve cash conversion
of acquired businesses
KLA+View entire presentation