Apollo Global Management Investor Day Presentation Deck
Endnotes
ATHENE
Athene's Advantages Drive Value Creation
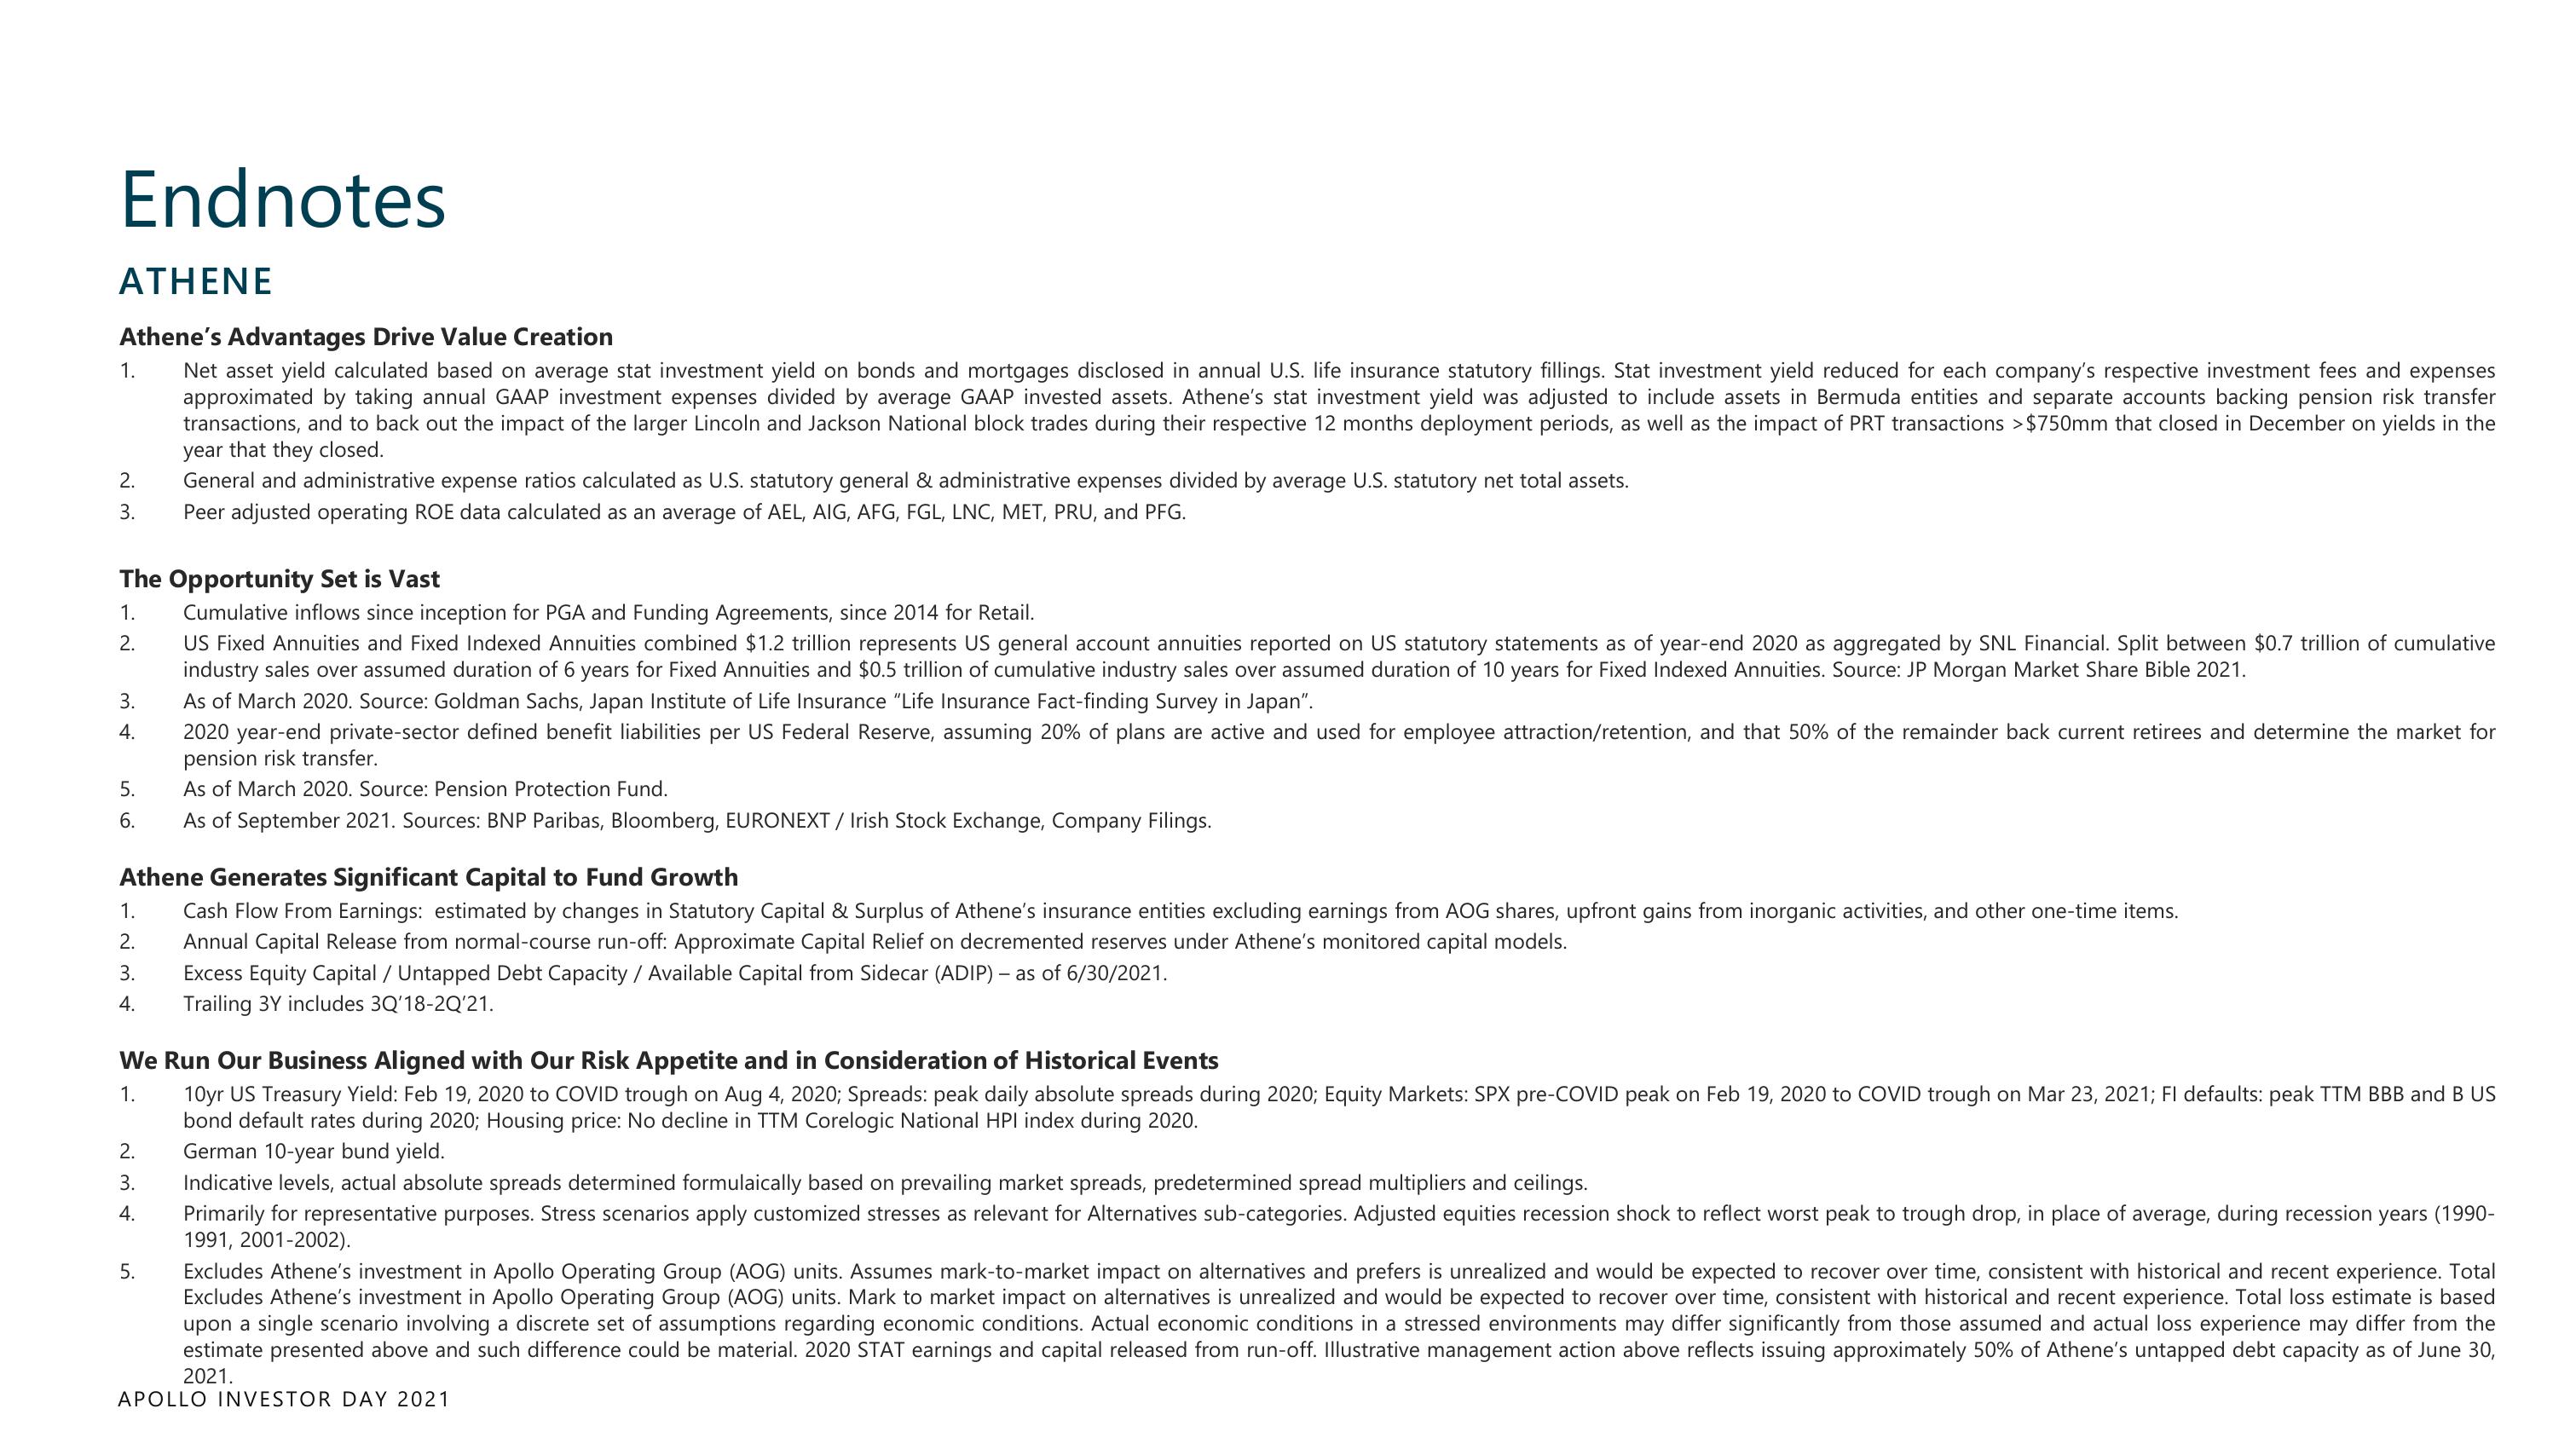
Net asset yield calculated based on average stat investment yield on bonds and mortgages disclosed in annual U.S. life insurance statutory fillings. Stat investment yield reduced for each company's respective investment fees and expenses
approximated by taking annual GAAP investment expenses divided by average GAAP invested assets. Athene's stat investment yield was adjusted to include assets in Bermuda entities and separate accounts backing pension risk transfer
transactions, and to back out the impact of the larger Lincoln and Jackson National block trades during their respective 12 months deployment periods, as well as the impact of PRT transactions >$750mm that closed in December on yields in the
year that they closed.
1.
2.
3.
The Opportunity Set is Vast
1.
Cumulative inflows since inception for PGA and Funding Agreements, since 2014 for Retail.
2.
US Fixed Annuities and Fixed Indexed Annuities combined $1.2 trillion represents US general account annuities reported on US statutory statements as of year-end 2020 as aggregated by SNL Financial. Split between $0.7 trillion of cumulative
industry sales over assumed duration of 6 years for Fixed Annuities and $0.5 trillion of cumulative industry sales over assumed duration of 10 years for Fixed Indexed Annuities. Source: JP Morgan Market Share Bible 2021.
As of March 2020. Source: Goldman Sachs, Japan Institute of Life Insurance "Life Insurance Fact-finding Survey in Japan".
2020 year-end private-sector defined benefit liabilities per US Federal Reserve, assuming 20% of plans are active and used for employee attraction/retention, and that 50% of the remainder back current retirees and determine the market for
pension risk transfer.
As of March 2020. Source: Pension Protection Fund.
As of September 2021. Sources: BNP Paribas, Bloomberg, EURONEXT / Irish Stock Exchange, Company Filings.
3.
4.
5.
6.
Athene Generates Significant Capital to Fund Growth
Cash Flow From Earnings: estimated by changes in Statutory Capital & Surplus of Athene's insurance entities excluding earnings from AOG shares, upfront gains from inorganic activities, and other one-time items.
Annual Capital Release from normal-course run-off: Approximate Capital Relief on decremented reserves under Athene's monitored capital models.
Excess Equity Capital / Untapped Debt Capacity / Available Capital from Sidecar (ADIP) - as of 6/30/2021.
Trailing 3Y includes 3Q'18-2Q'21.
1.
2.
3.
4.
General and administrative expense ratios calculated as U.S. statutory general & administrative expenses divided by average U.S. statutory net total assets.
Peer adjusted operating ROE data calculated as an average of AEL, AIG, AFG, FGL, LNC, MET, PRU, and PFG.
We Run Our Business Aligned with Our Risk Appetite and in Consideration of Historical Events
1.
10yr US Treasury Yield: Feb 19, 2020 to COVID trough on Aug 4, 2020; Spreads: peak daily absolute spreads during 2020; Equity Markets: SPX pre-COVID peak on Feb 19, 2020 to COVID trough on Mar 23, 2021; FI defaults: peak TTM BBB and B US
bond default rates during 2020; Housing price: No decline in TTM Corelogic National HPI index during 2020.
2.
3.
4.
5.
German 10-year bund yield.
Indicative levels, actual absolute spreads determined formulaically based on prevailing market spreads, predetermined spread multipliers and ceilings.
Primarily for representative purposes. Stress scenarios apply customized stresses as relevant for Alternatives sub-categories. Adjusted equities recession shock to reflect worst peak to trough drop, in place of average, during recession years (1990-
1991, 2001-2002).
Excludes Athene's investment in Apollo Operating Group (AOG) units. Assumes mark-to-market impact on alternatives and prefers is unrealized and would be expected to recover over time, consistent with historical and recent experience. Total
Excludes Athene's investment in Apollo Operating Group (AOG) units. Mark to market impact on alternatives is unrealized and would be expected to recover over time, consistent with historical and recent experience. Total loss estimate is based
upon a single scenario involving a discrete set of assumptions regarding economic conditions. Actual economic conditions in a stressed environments may differ significantly from those assumed and actual loss experience may differ from the
estimate presented above and such difference could be material. 2020 STAT earnings and capital released from run-off. Illustrative management action above reflects issuing approximately 50% of Athene's untapped debt capacity as of June 30,
2021.
APOLLO INVESTOR DAY 2021View entire presentation