Broadridge Financial Solutions Results Presentation Deck
C
D
00.00 (Unaudited)
0.0.
0
Reconciliation of GAAP to Non-GAAP Measures
3 Months Ended Mar. 31
2022
2021
$246.0
$239.2
D
Dollars in millions
Operating income (GAAP)
Adjustments:
Amortization of Acquired Intangibles and Purchased Intellectual Property
Acquisition and Integration Costs
Real Estate Realignment and Covid-19 Related Expenses (a)
Software Charge
Adjusted Operating income (Non-GAAP)
Operating income margin (GAAP)
Adjusted Operating income margin (Non-GAAP)
Dollars in millions
Net earnings (GAAP)
Adjustments:
Amortization of Acquired Intangibles and Purchased Intellectual Property
Acquisition and Integration Costs
Real Estate Realignment and Covid-19 Related Expenses (a)
Investment Gains
Software Charge
Loss on Acquisition-Related Financial Instrument
Subtotal of adjustments
Taxable impact of adjustments (b)
Adjusted Net earnings (Non-GAAP)
60.8
3.1
3.3
$313.3
16.0%
20.4%
2022
$176.6
60.8
3.1
3.3
-
31.9
9.2
3.3
67.2
(15.4)
$228.4
$283.6
17.2%
20.4%
3 Months Ended Mar. 31 9 Months Ended Mar. 31
2021
2022
2021
$165.0
$291.0
$287.1
31.9
9.2
3.3
9 Months Ended Mar. 31
2022
2021
$397.3
$418.2
9.6
54.0
(10.9)
$208.1
192.0
13.8
6.8
$630.8
10.5%
15.8%
192.0
13.8
6.8
(7.5)
96.8
11.6
41.1
6.0
$552.7
11.5%
16.0%
205.1
(44.1)
$452.0
96.8
11.6
41.1
(8.7)
6.0
9.6
156.3
(35.0)
$408.4
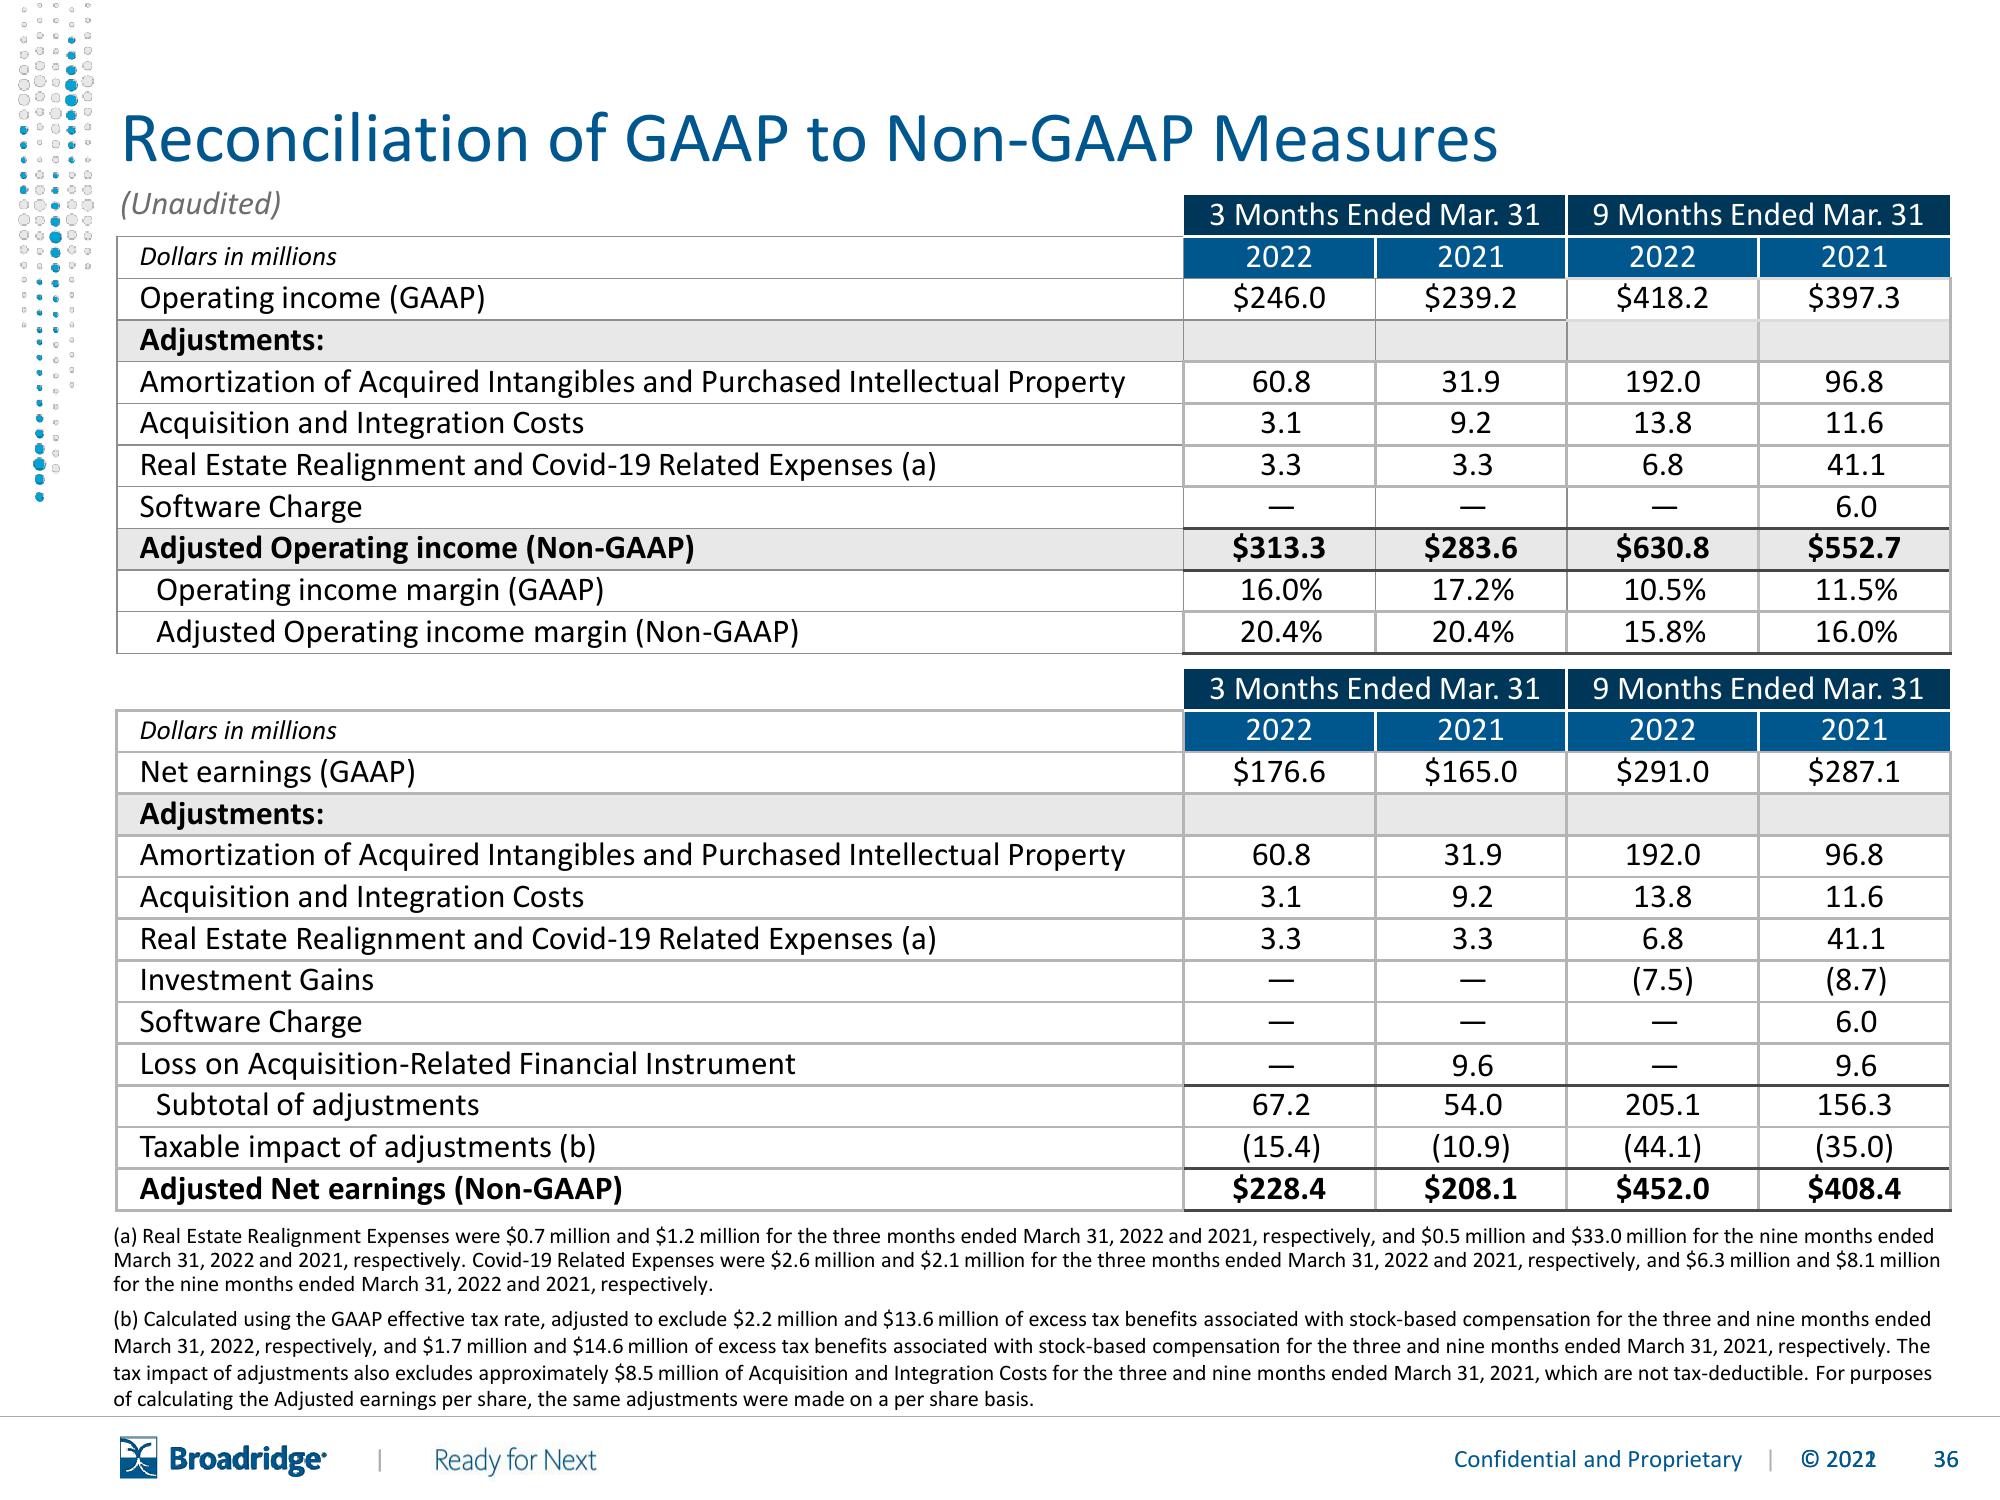
(a) Real Estate Realignment Expenses were $0.7 million and $1.2 million for the three months ended March 31, 2022 and 2021, respectively, and $0.5 million and $33.0 million for the nine months ended
March 31, 2022 and 2021, respectively. Covid-19 Related Expenses were $2.6 million and $2.1 million for the three months ended March 31, 2022 and 2021, respectively, and $6.3 million and $8.1 million
for the nine months ended March 31, 2022 and 2021, respectively.
(b) Calculated using the GAAP effective tax rate, adjusted to exclude $2.2 million and $13.6 million of excess tax benefits associated with stock-based compensation for the three and nine months ended
March 31, 2022, respectively, and $1.7 million and $14.6 million of excess tax benefits associated with stock-based compensation for the three and nine months ended March 31, 2021, respectively. The
tax impact of adjustments also excludes approximately $8.5 million of Acquisition and Integration Costs for the three and nine months ended March 31, 2021, which are not tax-deductible. For purposes
of calculating the Adjusted earnings per share, the same adjustments were made on a per share basis.
Broadridge
I Ready for Next
Confidential and Proprietary © 2022
36View entire presentation