Apollo Global Management Investor Day Presentation Deck
Reconciliation of GAAP to Non-GAAP Financial Measures
ATHENE
(in millions)
GAAP net investment income
Change in fair value of reinsurance assets
Alternative income gain (loss)
ACRA noncontrolling interest
Apollo investment (income) loss
Held for trading amortization and other
Total adjustments to arrive at net investment earnings
Total net investment earnings
GAAP net investment income rate
Change in fair value of reinsurance assets
Alternative income gain (loss)
ACRA noncontrolling interest
Apollo investment (income) loss
Held for trading amortization and other
Total adjustments to arrive at net investment earned rate
Consolidated net investment earned rate
Consolidated average net invested assets ex. Apollo investment
APOLLO INVESTOR DAY 2021
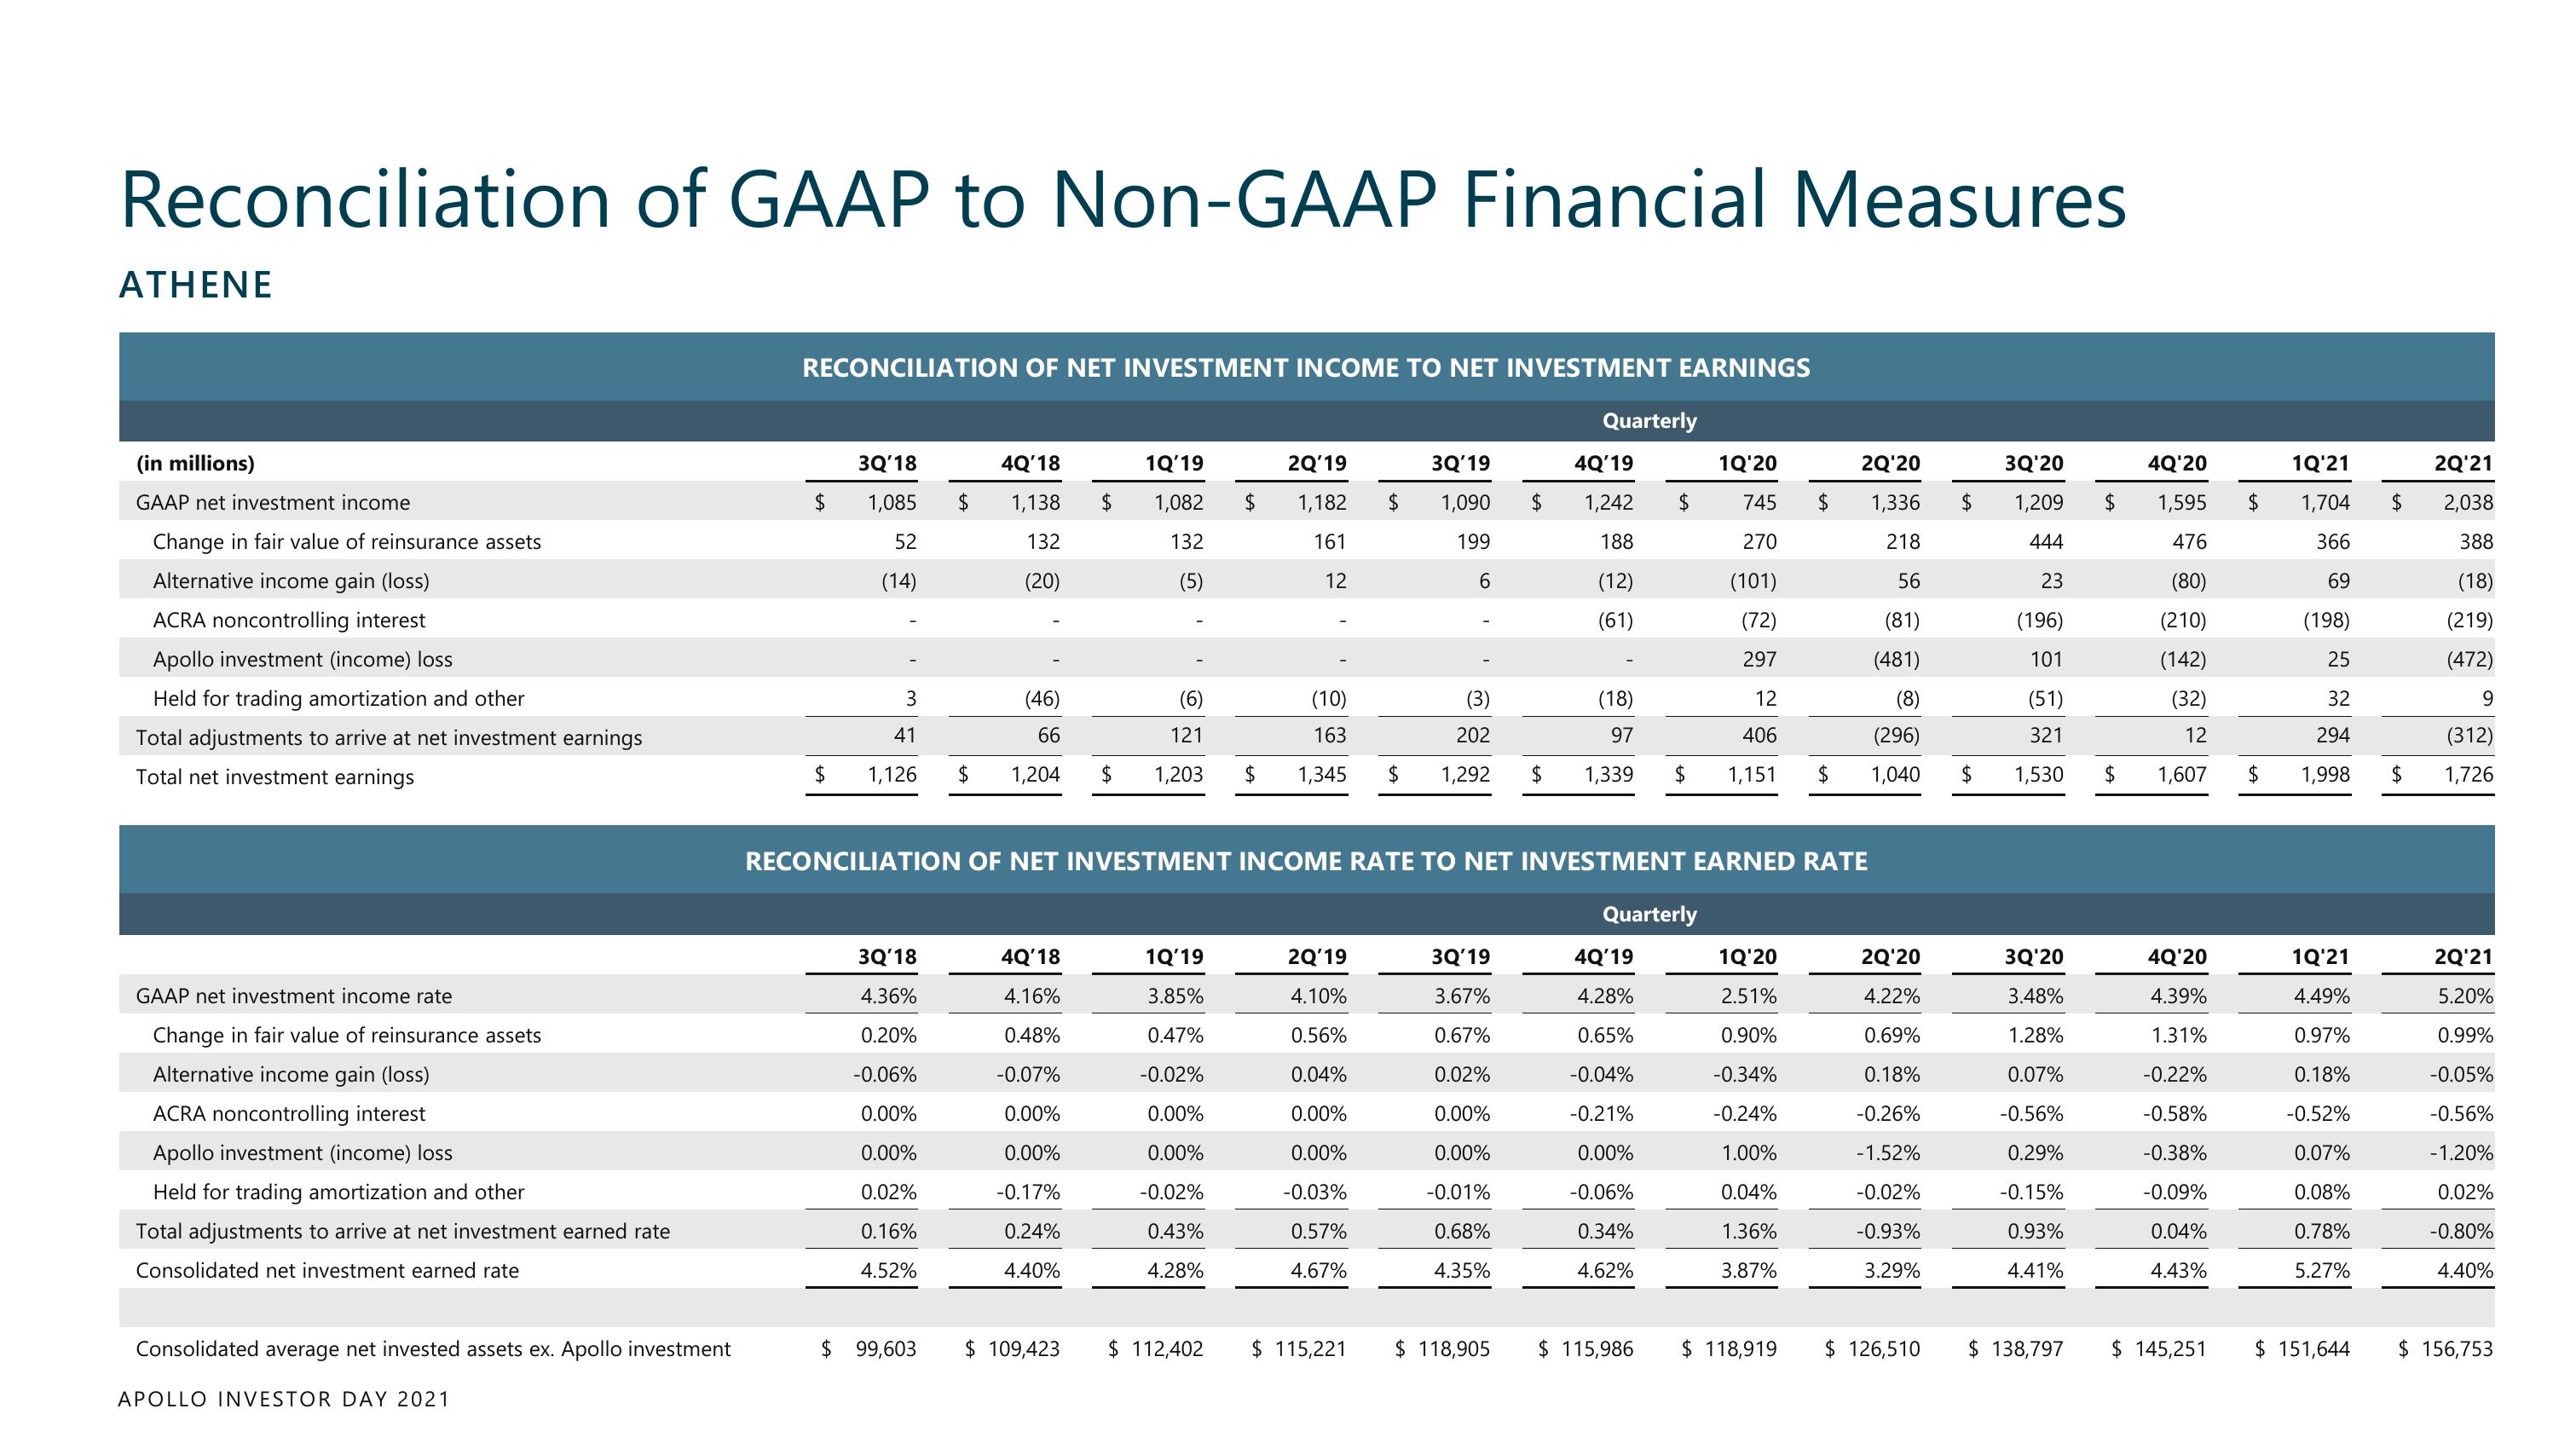
RECONCILIATION OF NET INVESTMENT INCOME TO NET INVESTMENT EARNINGS
$
$
3Q'18
1,085
52
(14)
3
41
1,126
3Q'18
4.36%
0.20%
-0.06%
0.00%
0.00%
0.02%
0.16%
4.52%
4Q'18
$ 1,138
132
(20)
$ 99,603
(46)
66
$ 1,204
4Q'18
4.16%
0.48%
-0.07%
0.00%
0.00%
-0.17%
0.24%
4.40%
$
$ 109,423
1Q'19
1,082
132
(5)
(6)
121
$ 1,203
1Q'19
3.85%
0.47%
-0.02%
0.00%
0.00%
-0.02%
0.43%
4.28%
$ 112,402
2Q'19
1,182 $
161
12
2Q'20
$ 1,336
218
56
(81)
(481)
(8)
202
(296)
$ 1,345 $ 1,292 $ 1,339 $ 1,151 $ 1,040
(10)
163
RECONCILIATION OF NET INVESTMENT INCOME RATE TO NET INVESTMENT EARNED RATE
2Q'19
4.10%
0.56%
0.04%
0.00%
0.00%
-0.03%
0.57%
4.67%
3Q'19
1,090
199
6
$ 115,221
3Q'19
3.67%
0.67%
0.02%
0.00%
0.00%
-0.01%
0.68%
4.35%
Quarterly
$
$ 118,905
4Q'19
1,242
188
(12)
(61)
(18)
97
Quarterly
4Q'19
4.28%
0.65%
-0.04%
-0.21%
0.00%
-0.06%
0.34%
4.62%
1Q'20
745
270
(101)
(72)
297
$ 115,986
12
406
1Q'20
2.51%
0.90%
-0.34%
-0.24%
1.00%
0.04%
1.36%
3.87%
$ 118,919
2Q'20
4.22%
0.69%
0.18%
-0.26%
-1.52%
-0.02%
-0.93%
3.29%
$ 126,510
3Q'20
1,209
444
23
(196)
101
(51)
321
$ 1,530
$
3Q'20
3.48%
1.28%
0.07%
-0.56%
0.29%
-0.15%
0.93%
4.41%
$ 138,797
4Q'20
1,595
476
(80)
(210)
(142)
(32)
12
$ 1,607 $
4Q'20
4.39%
1.31%
-0.22%
-0.58%
-0.38%
-0.09%
0.04%
4.43%
$ 145,251
1Q'21
$ 1,704
366
69
(198)
25
32
294
1,998
1Q'21
4.49%
0.97%
0.18%
-0.52%
0.07%
0.08%
0.78%
5.27%
$ 151,644
$
$
2Q'21
2,038
388
(18)
(219)
(472)
9
(312)
1,726
2Q'21
5.20%
0.99%
-0.05%
-0.56%
-1.20%
0.02%
-0.80%
4.40%
$ 156,753View entire presentation