Apollo Global Management Investor Day Presentation Deck
Reconciliation of GAAP to Non-GAAP Financial Measures
ATHENE
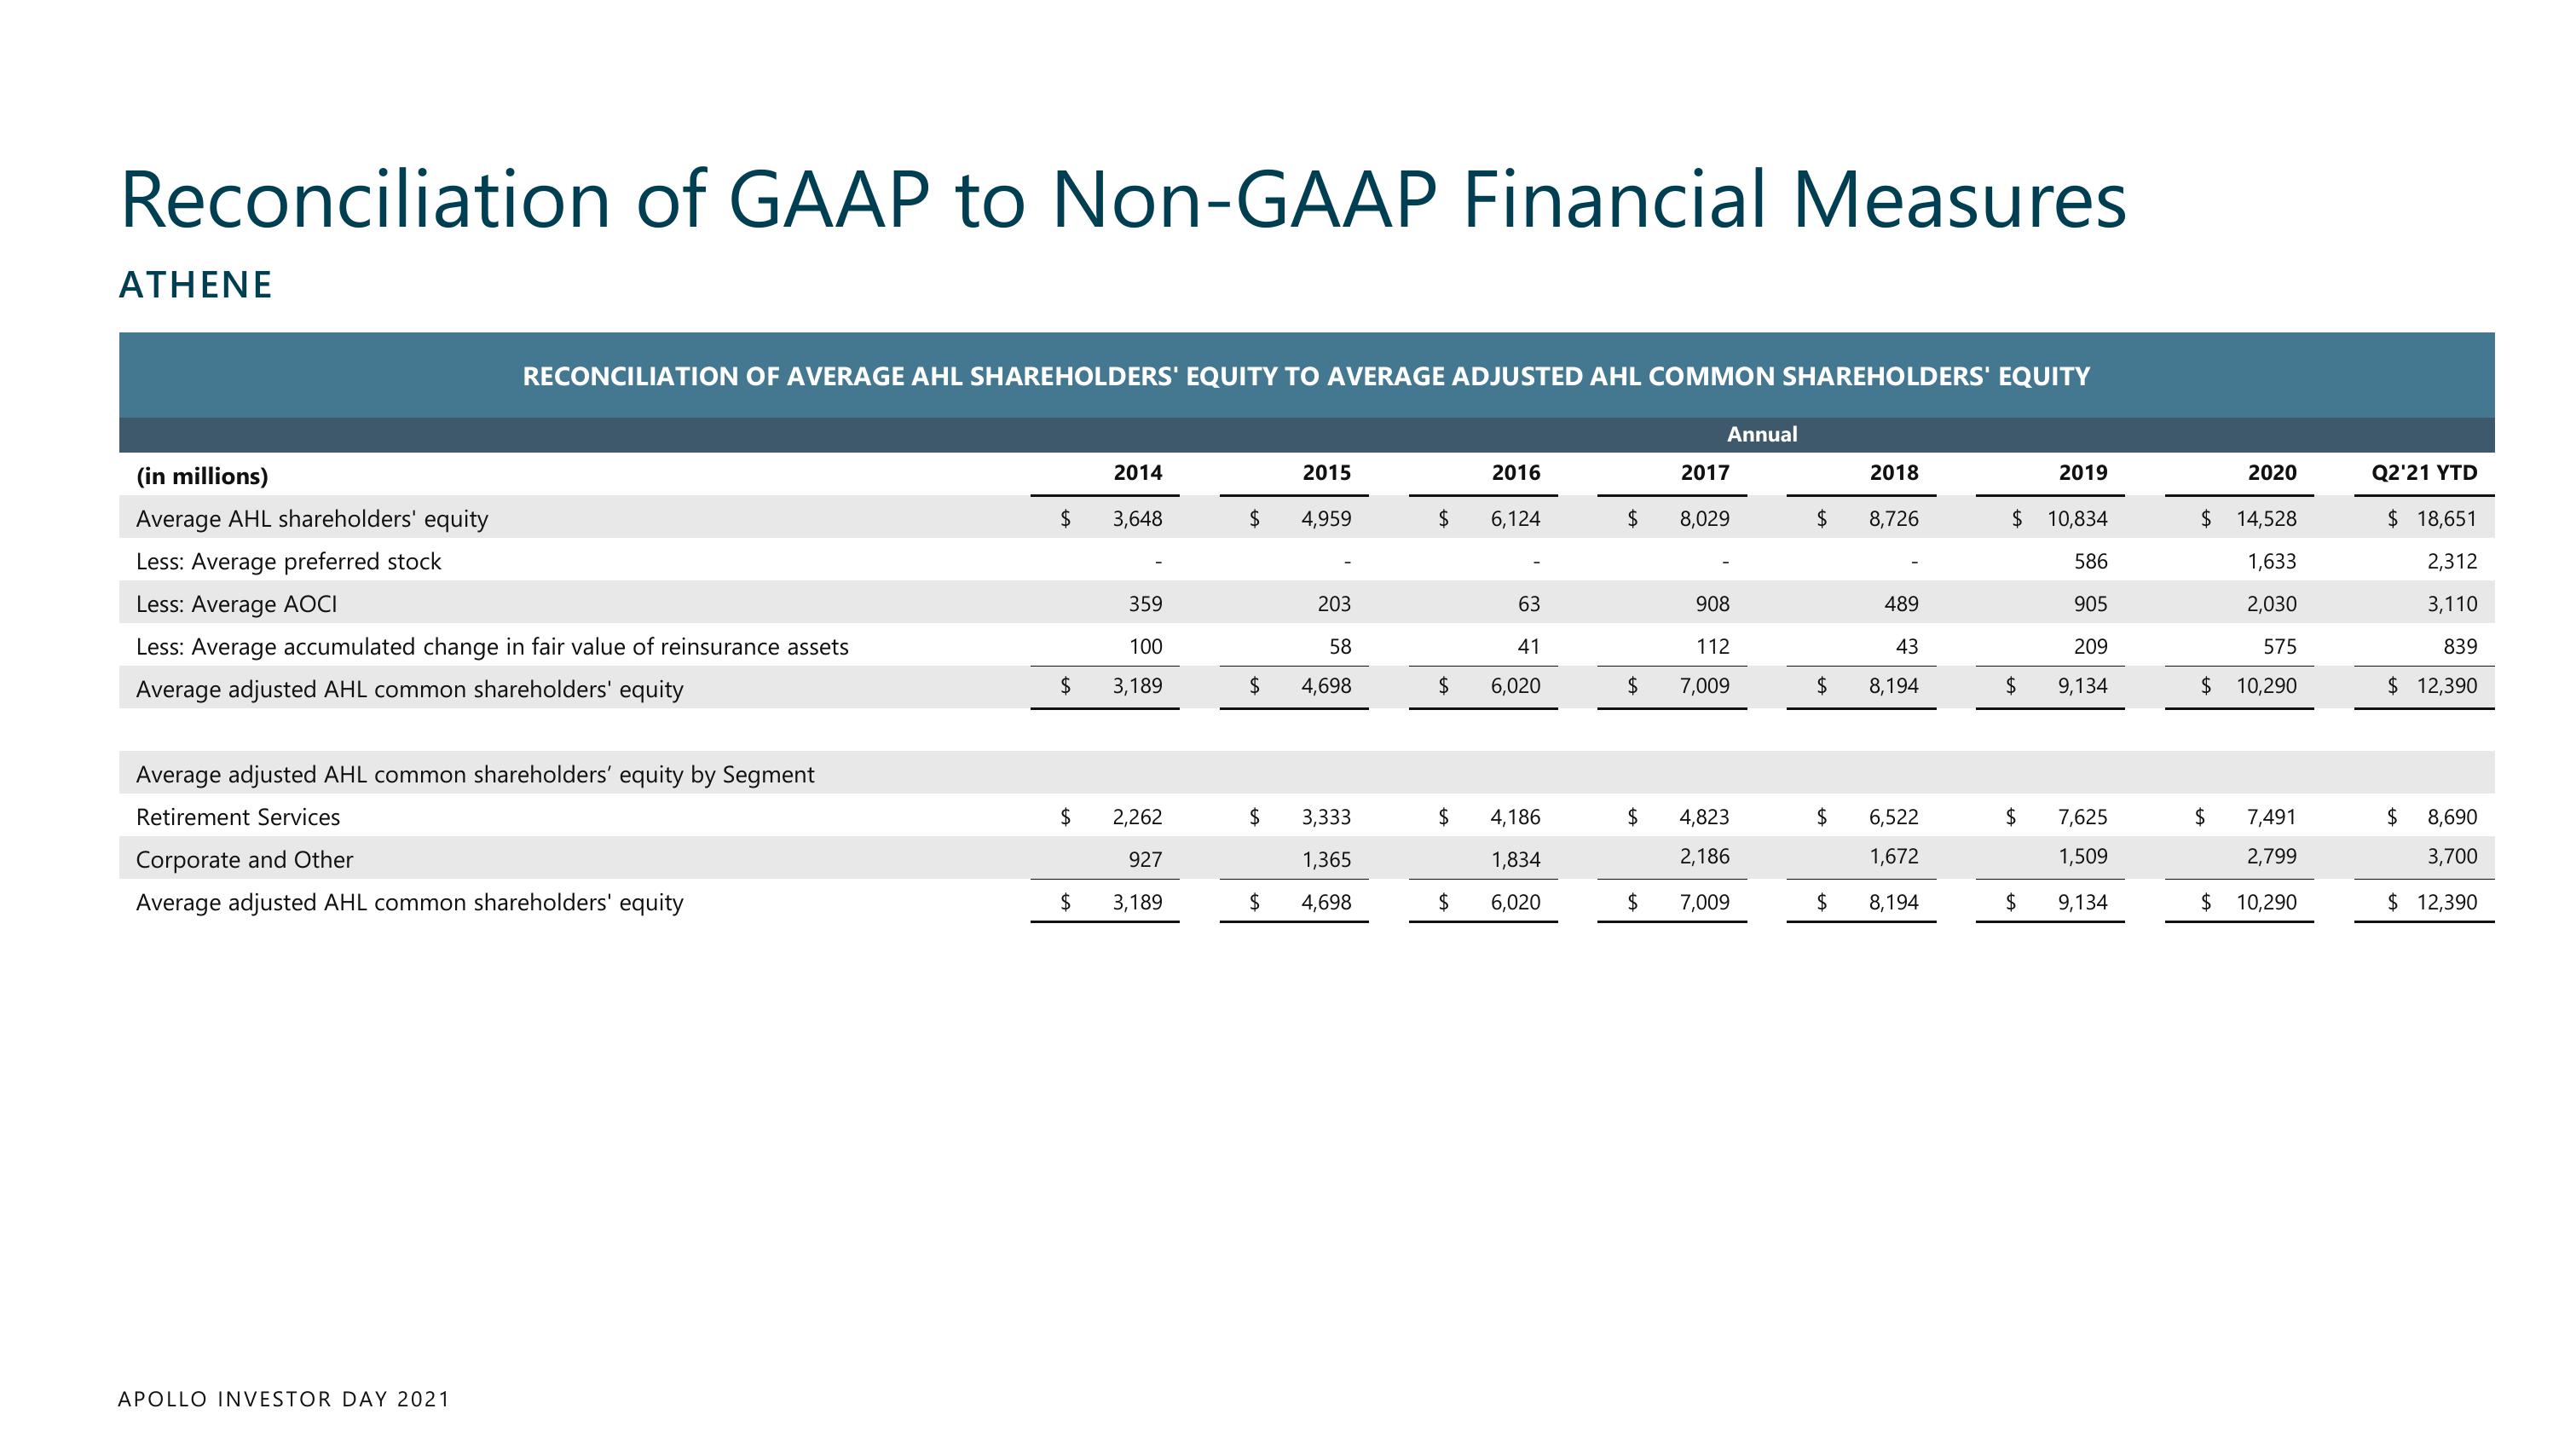
RECONCILIATION OF AVERAGE AHL SHAREHOLDERS' EQUITY TO AVERAGE ADJUSTED AHL COMMON SHAREHOLDERS' EQUITY
(in millions)
Average AHL shareholders' equity
Less: Average preferred stock
Less: Average AOCI
Less: Average accumulated change in fair value of reinsurance assets
Average adjusted AHL common shareholders' equity
Average adjusted AHL common shareholders' equity by Segment
Retirement Services
Corporate and Other
Average adjusted AHL common shareholders' equity
APOLLO INVESTOR DAY 2021
$
$
$
$
2014
3,648
359
100
3,189
2,262
927
3,189
$
$
2015
4,959
203
58
4,698
3,333
1,365
$ 4,698
$
$
2016
6,124
63
41
6,020
4,186
1,834
6,020
$
$
$
$
Annual
2017
8,029
908
112
7,009
4,823
2,186
7,009
$
$
$
$
2018
8,726
489
43
8,194
6,522
1,672
8,194
2019
$ 10,834
586
905
209
9,134
$
$
$
7,625
1,509
9,134
2020
14,528
1,633
2,030
575
$ 10,290
$
$
$
7,491
2,799
10,290
Q2'21 YTD
$ 18,651
2,312
3,110
839
$ 12,390
$
8,690
3,700
$ 12,390View entire presentation