Apollo Global Management Investor Day Presentation Deck
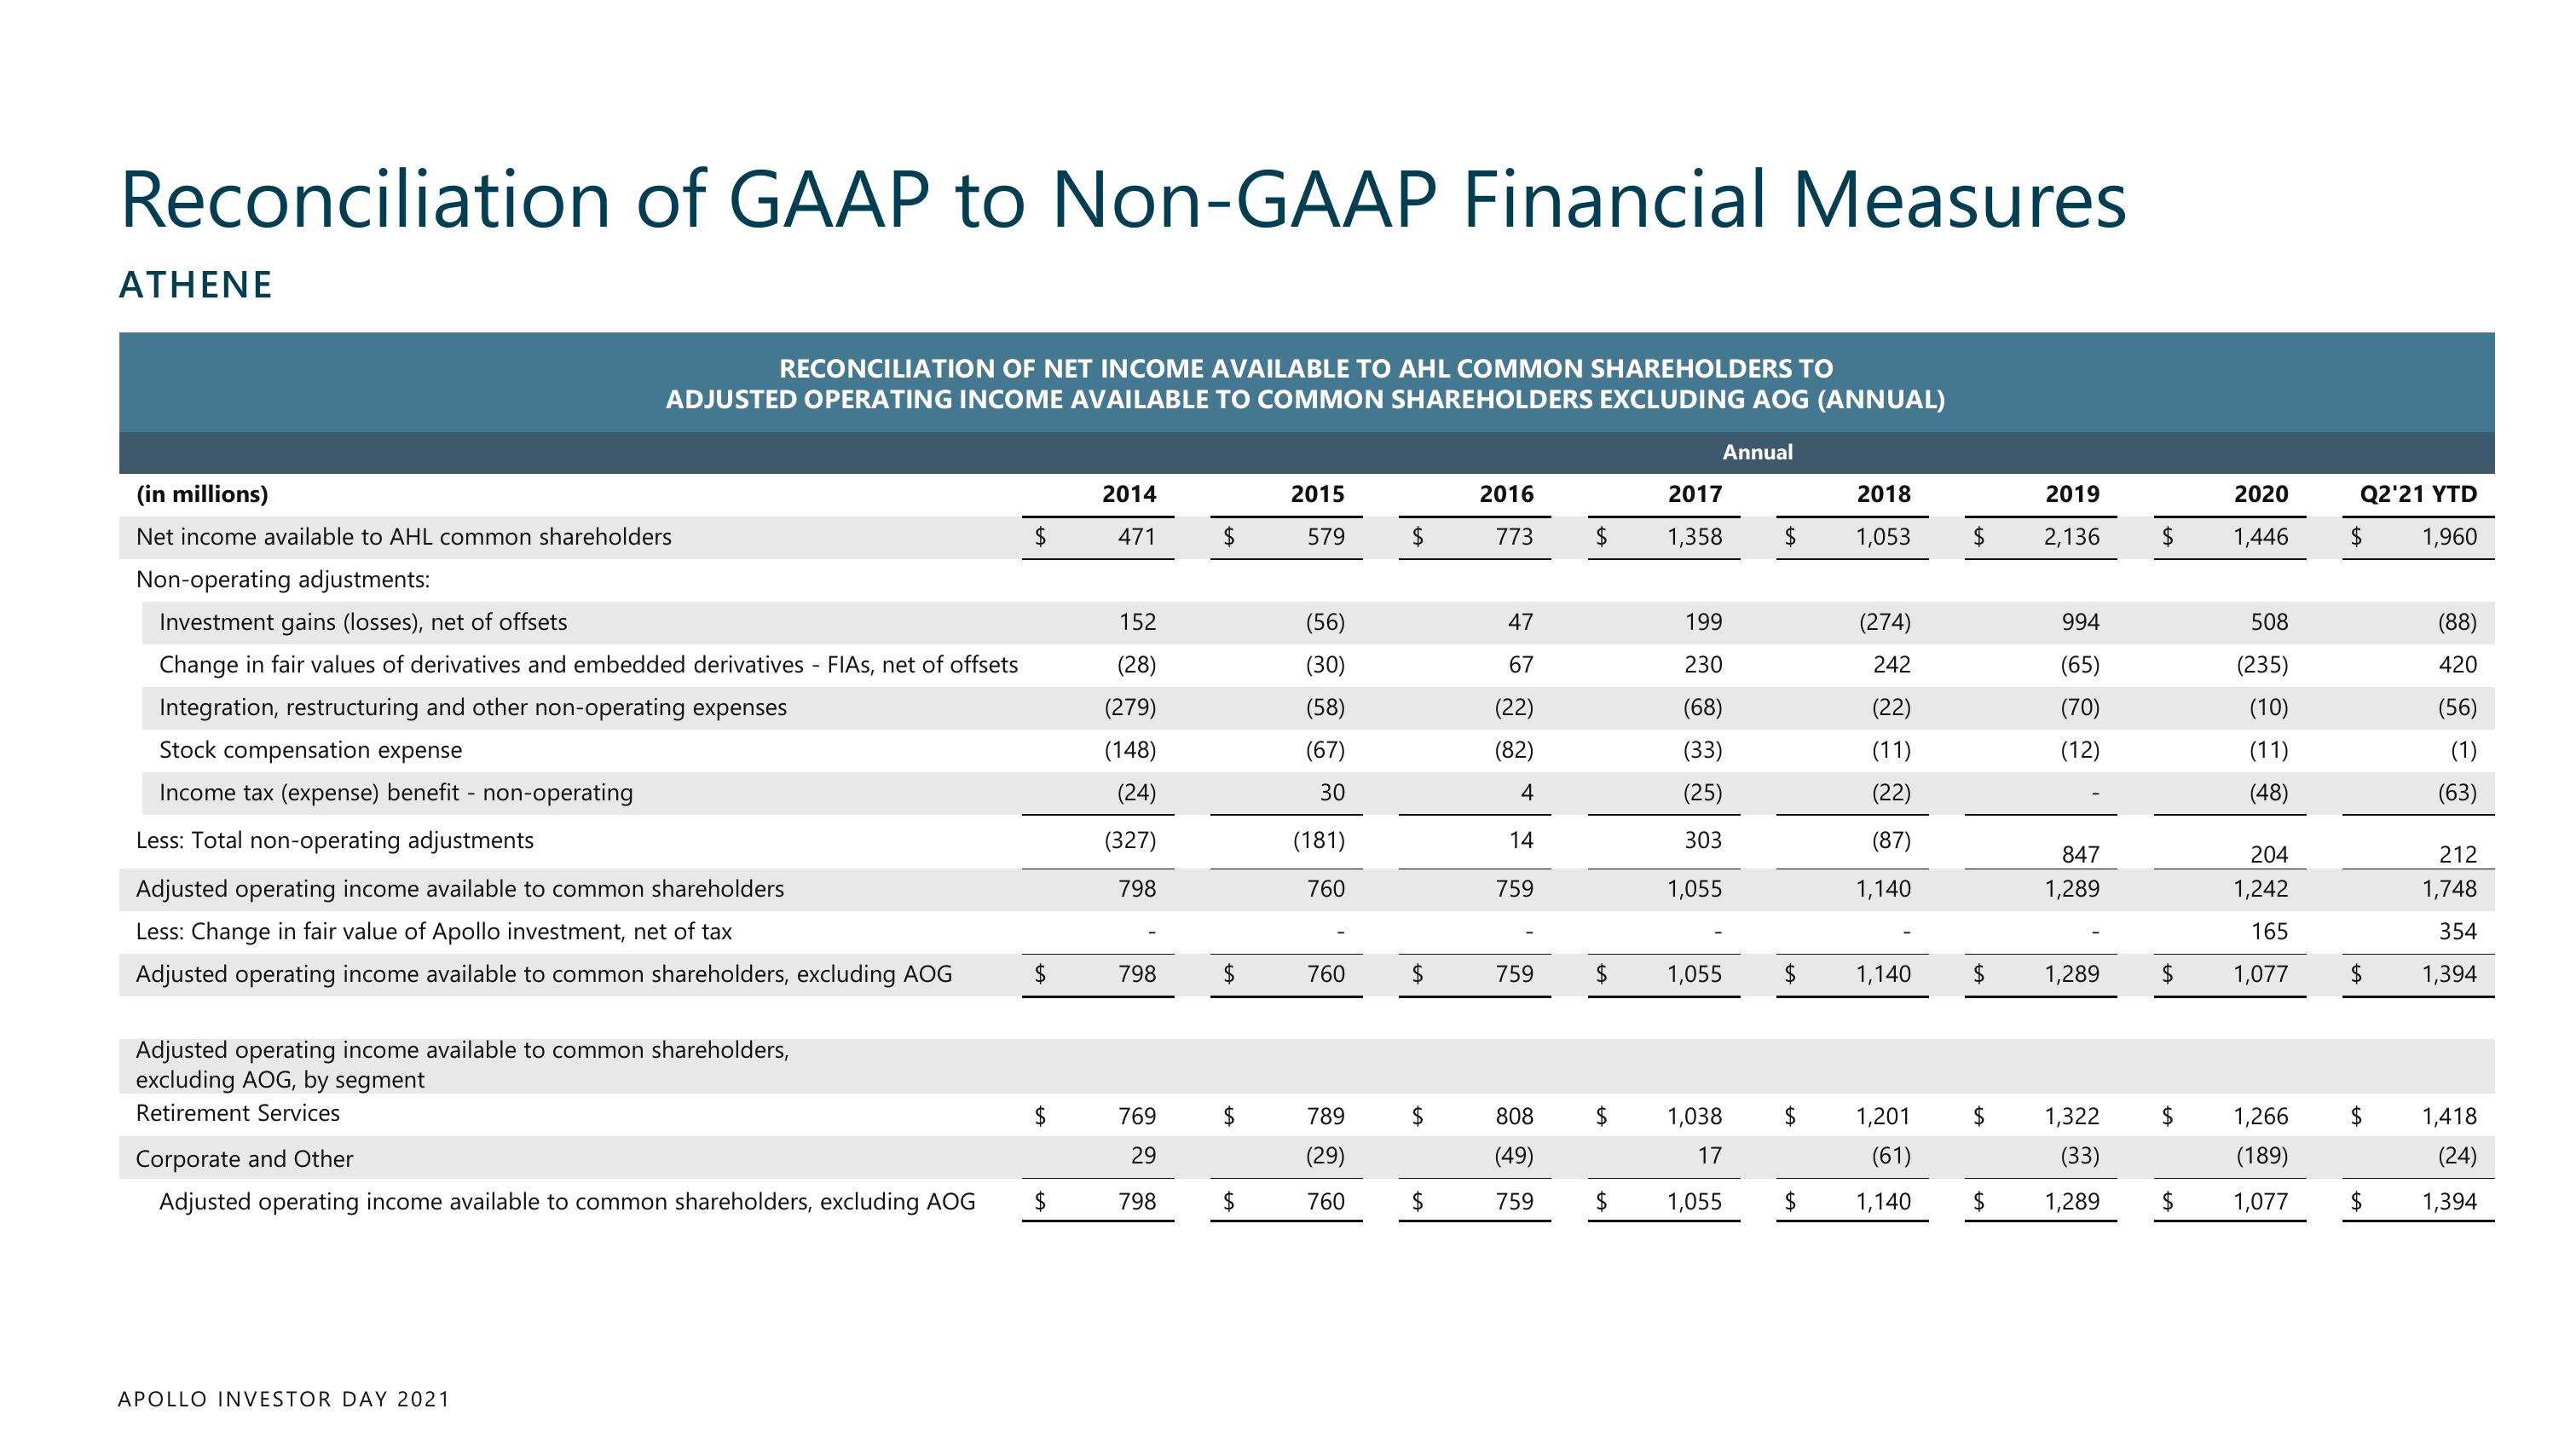
Reconciliation of GAAP to Non-GAAP Financial Measures
ATHENE
RECONCILIATION OF NET INCOME AVAILABLE TO AHL COMMON SHAREHOLDERS TO
ADJUSTED OPERATING INCOME AVAILABLE TO COMMON SHAREHOLDERS EXCLUDING AOG (ANNUAL)
(in millions)
Net income available to AHL common shareholders
Non-operating adjustments:
Investment gains (losses), net of offsets
Change in fair values of derivatives and embedded derivatives - FIAS, net of offsets
Integration, restructuring and other non-operating expenses
Stock compensation expense
Income tax (expense) benefit - non-operating
Less: Total non-operating adjustments
Adjusted operating income available to common shareholders
Less: Change in fair value of Apollo investment, net of tax
Adjusted operating income available to common shareholders, excluding AOG
Adjusted operating income available to common shareholders,
excluding AOG, by segment
Retirement Services
Corporate and Other
Adjusted operating income available to common shareholders, excluding AOG
APOLLO INVESTOR DAY 2021
$
$
$
2014
471
152
(28)
(279)
(148)
(24)
(327)
798
798
769
29
798
$
$
$
2015
579
(56)
(30)
(58)
(67)
30
(181)
760
760
789
(29)
760
$
$
$
$
2016
773
47
67
(22)
(82)
4
14
759
759
808
(49)
759
Annual
2017
$ 1,358
$
199
230
(68)
(33)
(25)
303
1,055
1,055
1,038
17
1,055
$
$
2018
1,053
(274)
242
(22)
(11)
(22)
(87)
1,140
1,140
1,201
(61)
1,140
$
2019
2,136
994
(65)
(70)
(12)
847
1,289
1,289
1,322
(33)
1,289
$
2020
1,446
508
(235)
(10)
(11)
(48)
204
1,242
165
1,077
1,266
(189)
1,077
Q2'21 YTD
$ 1,960
$
(88)
420
(56)
(1)
(63)
212
1,748
354
1,394
1,418
(24)
1,394View entire presentation