Paysafe Results Presentation Deck
Q1 financial highlights
Volume(¹) ($bn)
margin
$27.5
Q1 2021
$113.2
+13%
Q1 2021
30.0%
$31.2
Adj. EBITDA (2) ($m)
Q1 2022
-8% -5% CC
$104.0
Q1 2022
28.3%
Revenue ($m)
$377.4
Q1 2021
take rate 1.4%
-3% Flat cc
$380.4
FCF(2) ($m)
-38%
$367.7
Q1 2022
1.2%
Note: Volume = total volume. Take rate = total revenue divided by volume.
Paysafe:122 Volume excludes embedded finance-related volumes of approximately $4.4 billion.
$237.0
LTM March '21 LTM March '22
●
●
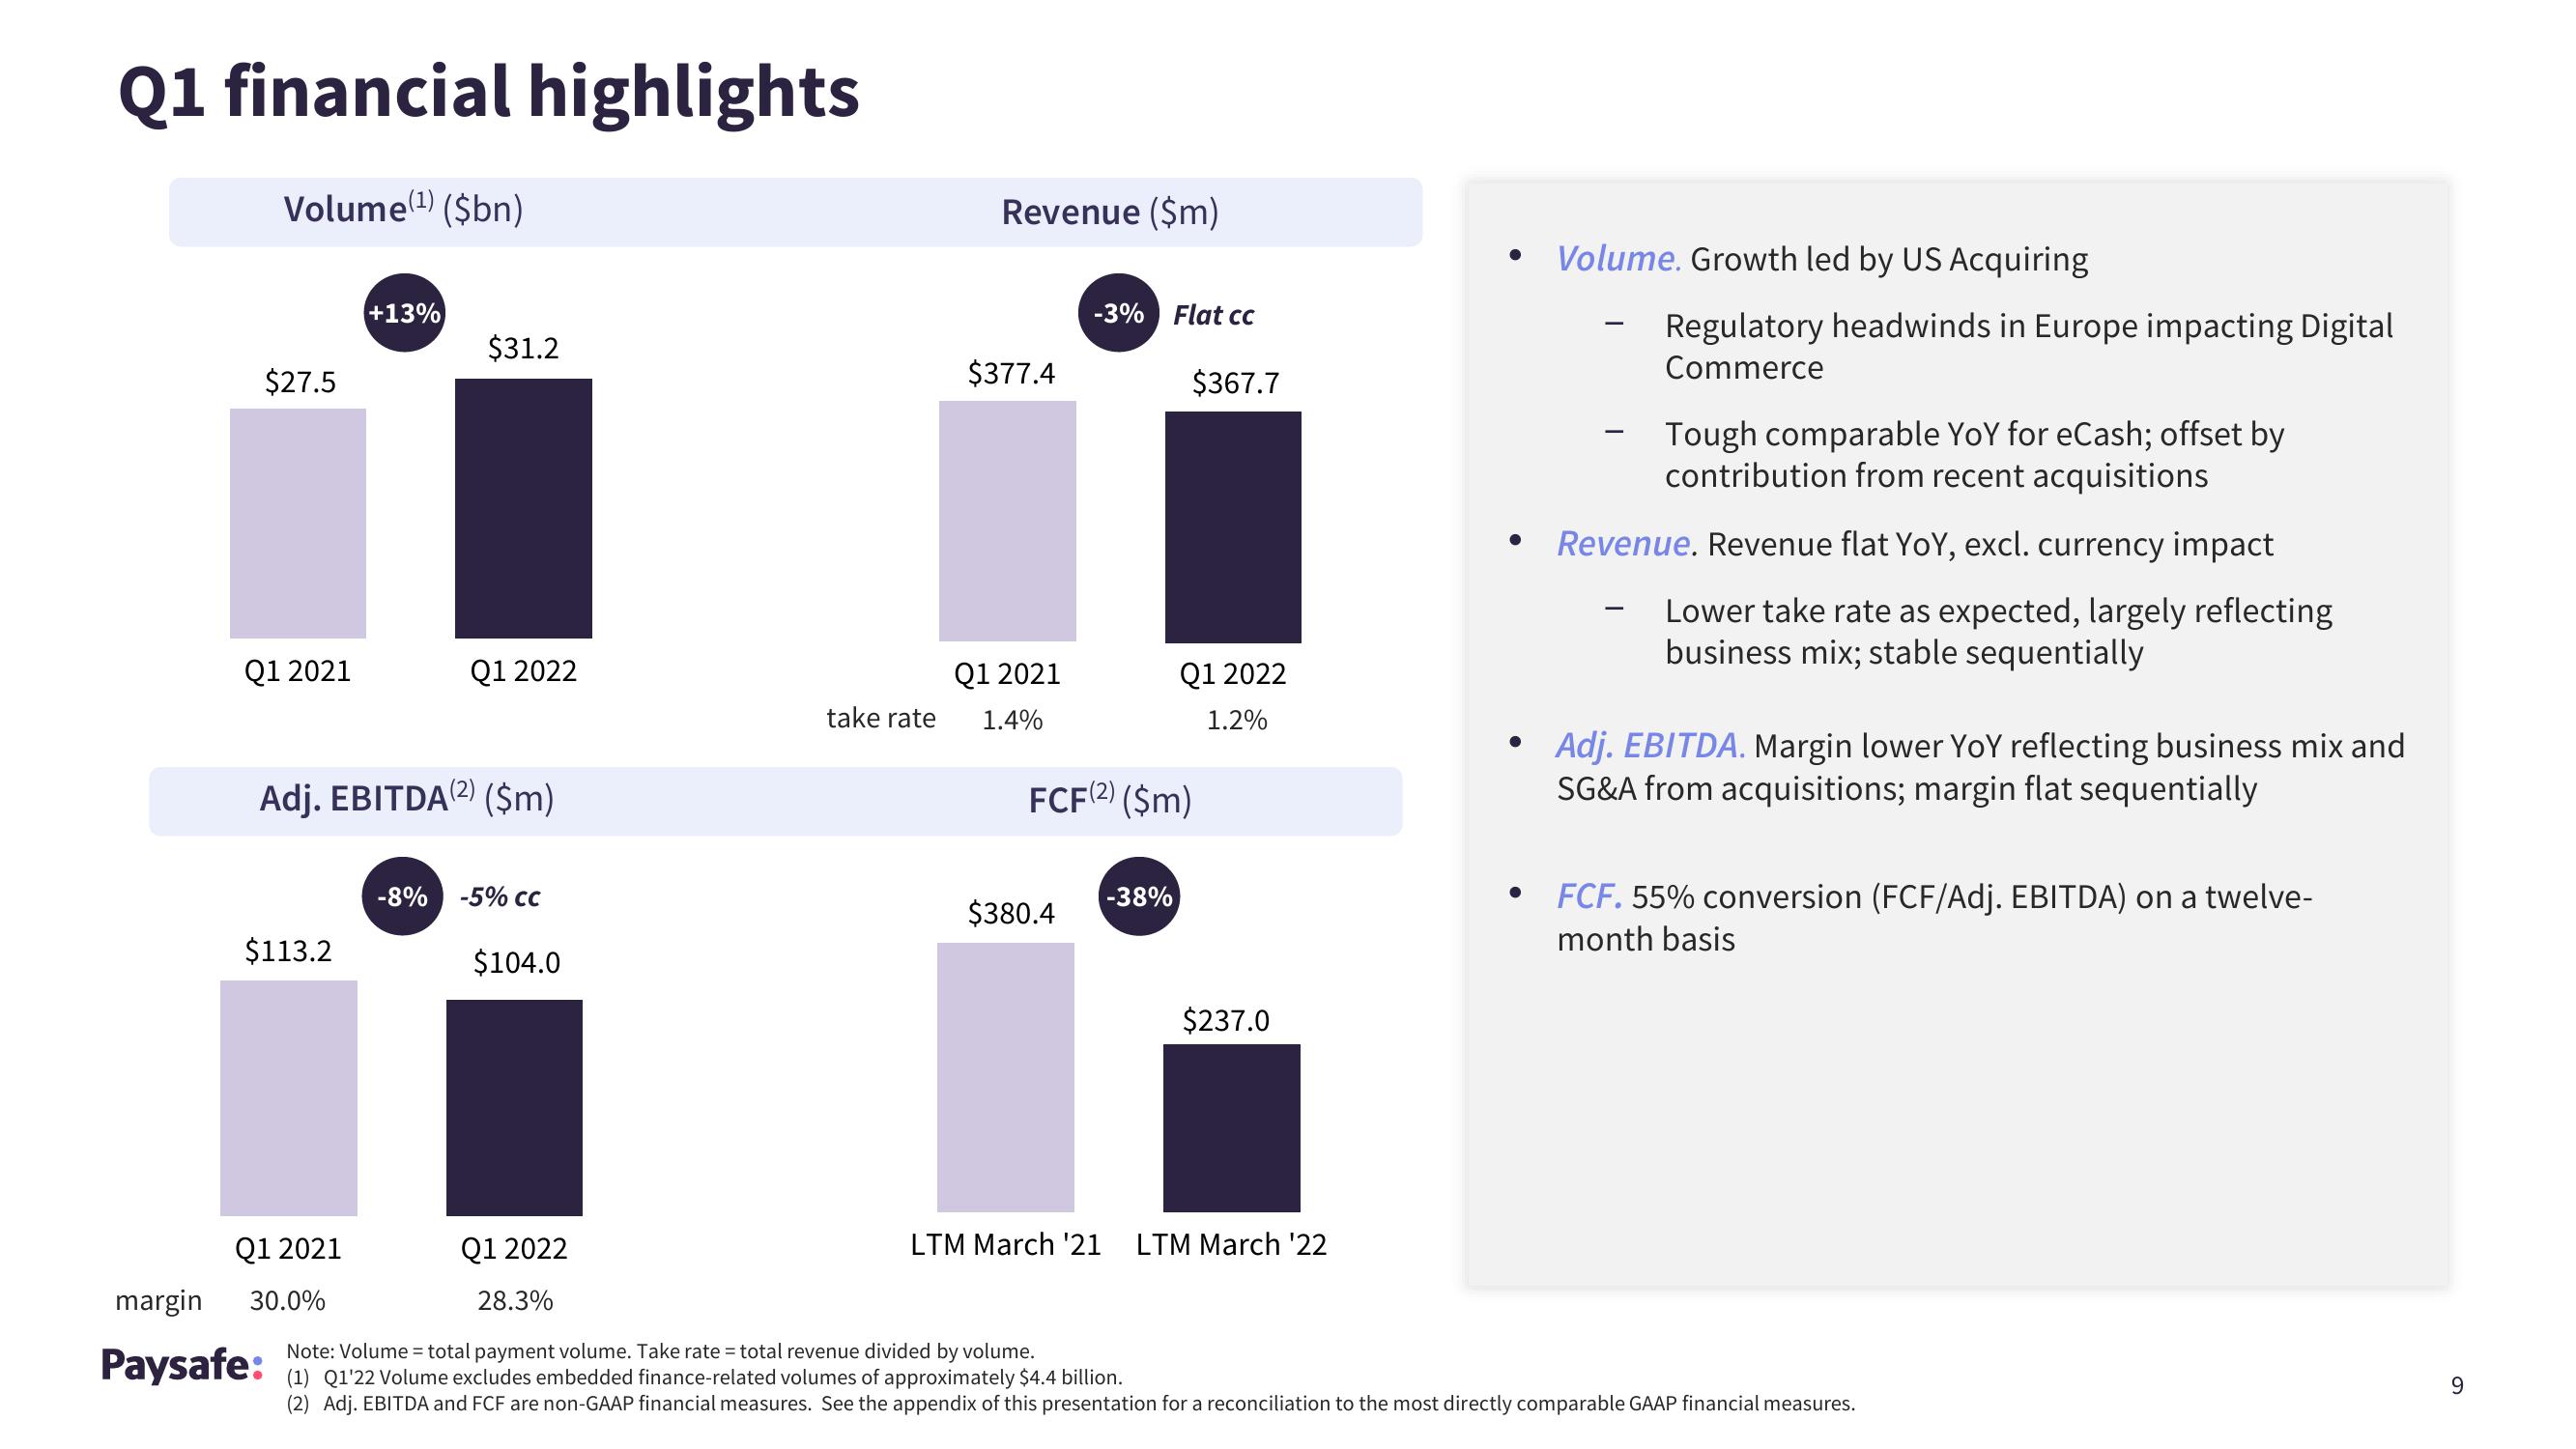
Volume. Growth led by US Acquiring
Regulatory headwinds in Europe impacting Digital
Commerce
Tough comparable YoY for eCash; offset by
contribution from recent acquisitions
Revenue. Revenue flat YoY, excl. currency impact
Lower take rate as expected, largely reflecting
business mix; stable sequentially
Adj. EBITDA. Margin lower YoY reflecting business mix and
SG&A from acquisitions; margin flat sequentially
FCF. 55% conversion (FCF/Adj. EBITDA) on a twelve-
month basis
(2) Adj. EBITDA and FCF are non-GAAP financial measures. See the appendix of this presentation for a reconciliation to the most directly comparable GAAP financial measures.
9View entire presentation