Apollo Global Management Investor Day Presentation Deck
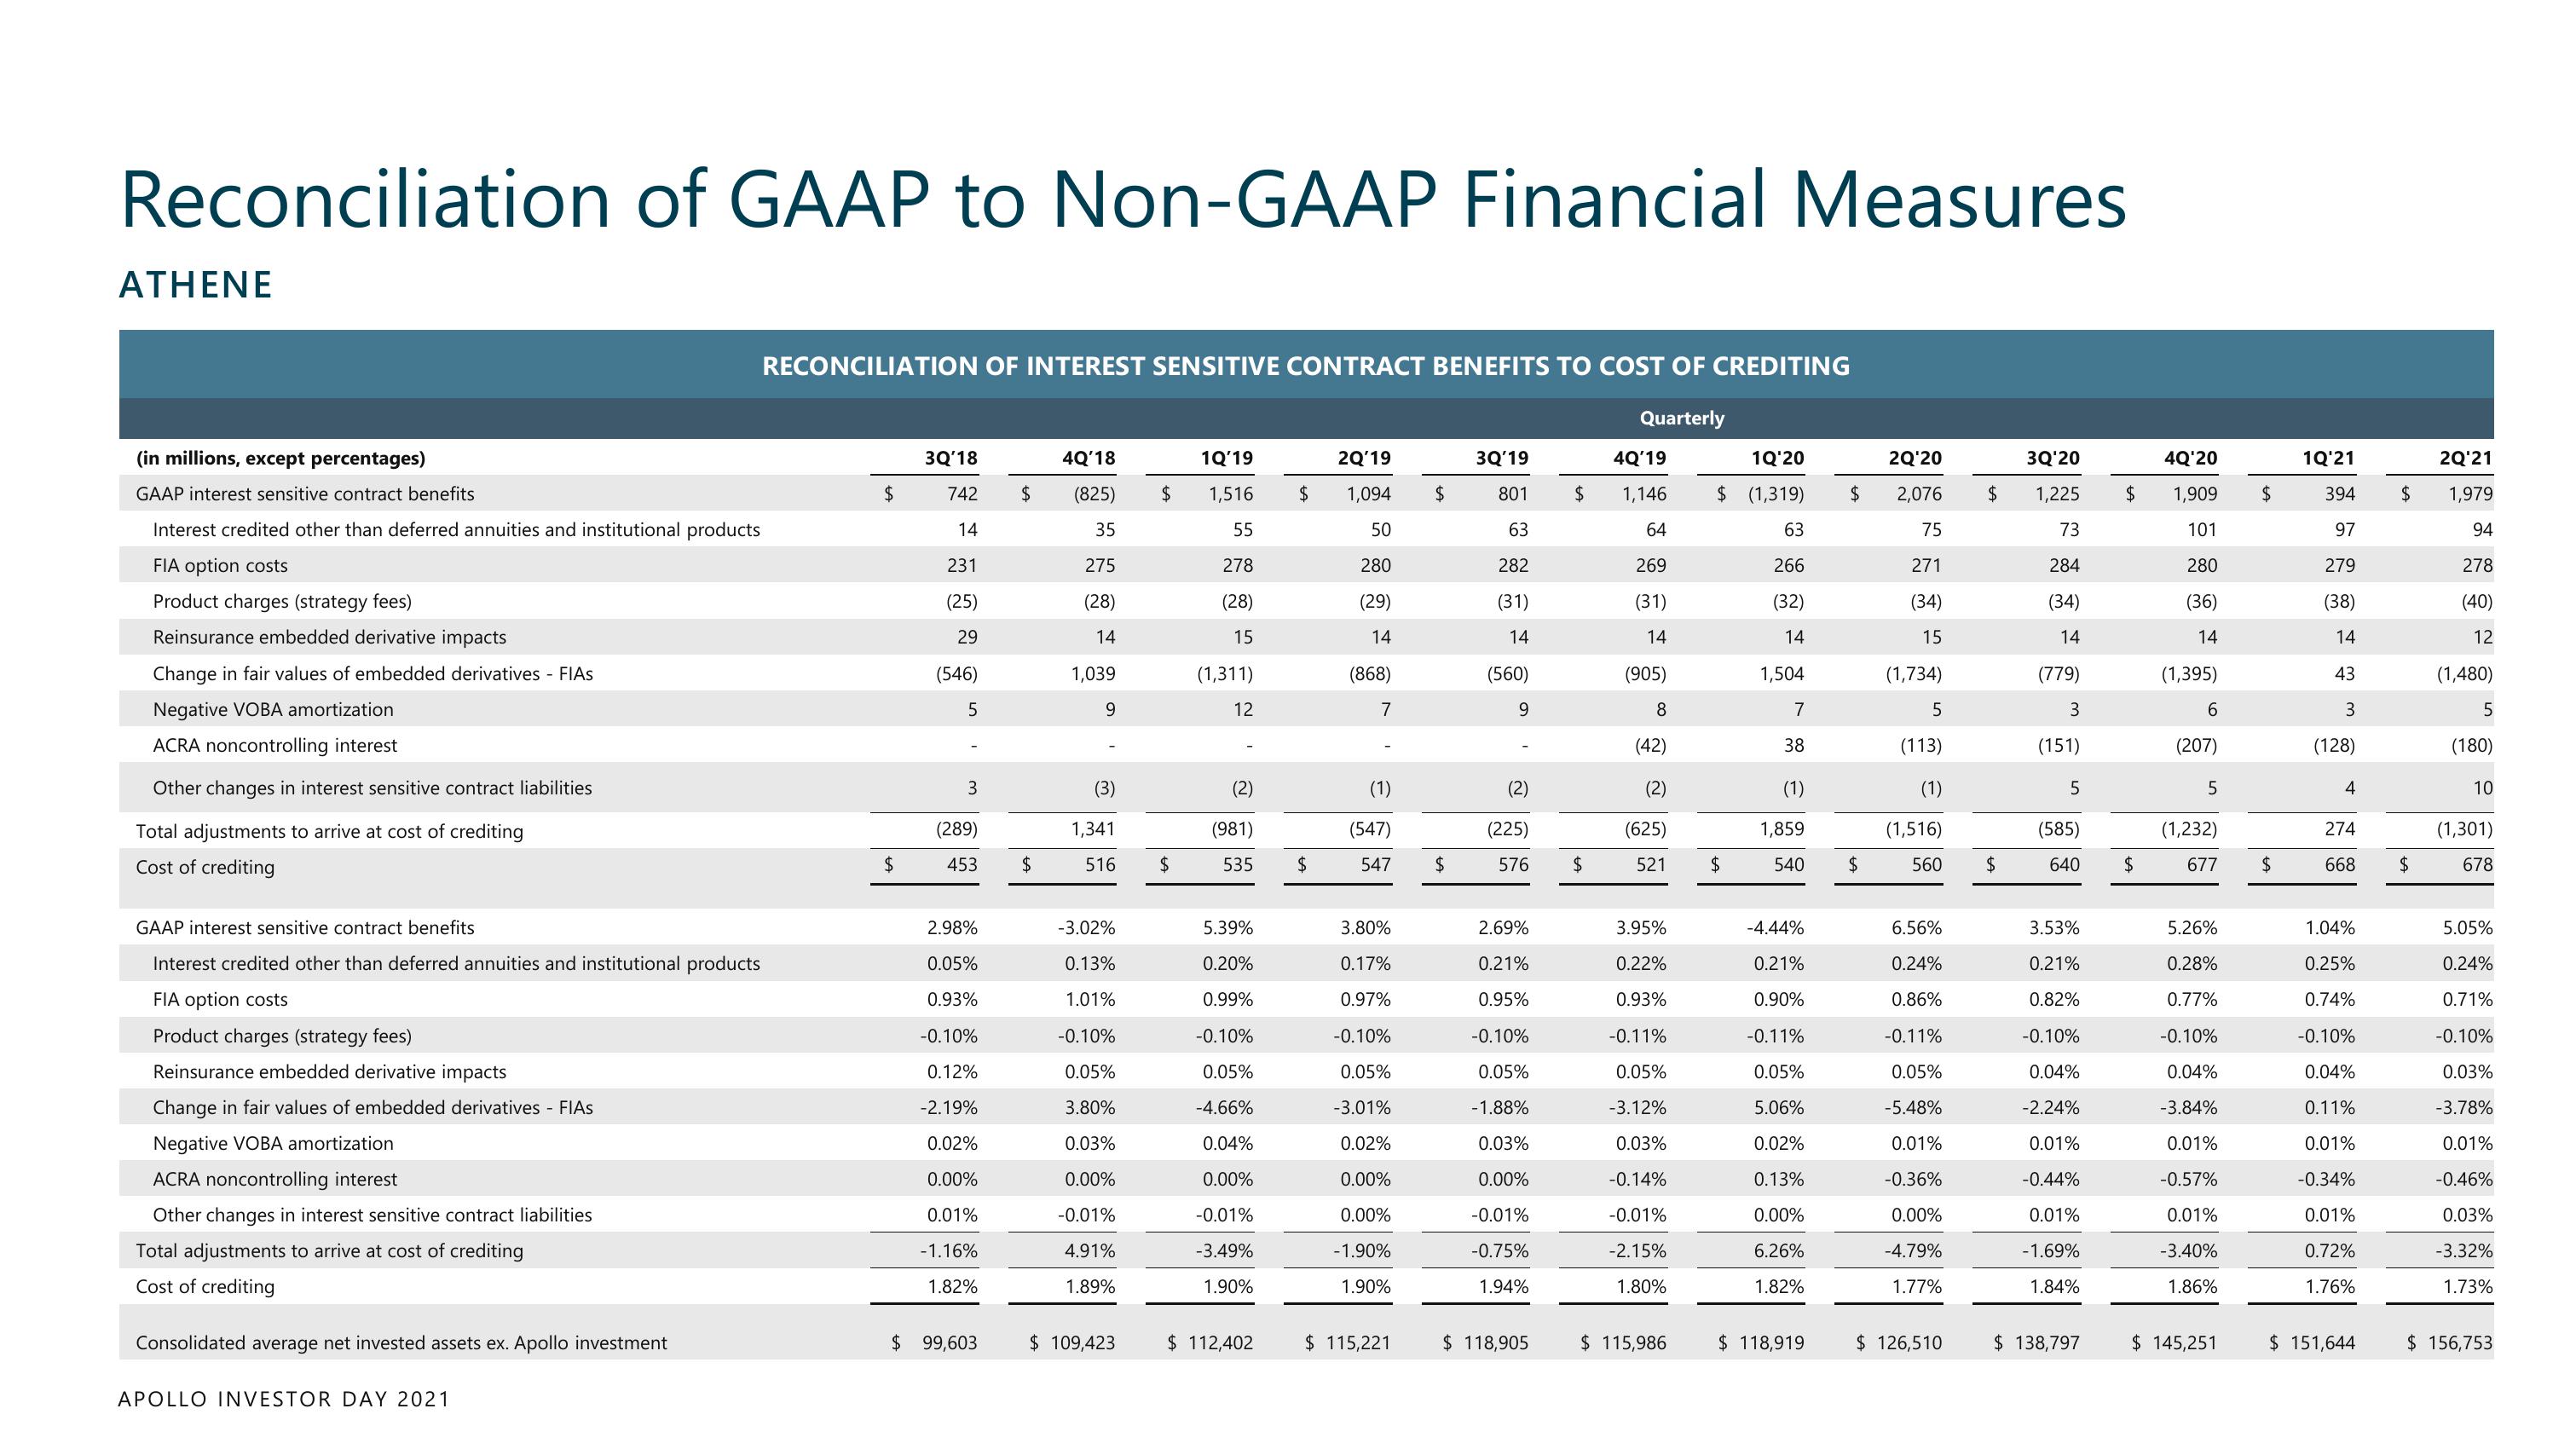
Reconciliation of GAAP to Non-GAAP Financial Measures
ATHENE
(in millions, except percentages)
GAAP interest sensitive contract benefits
Interest credited other than deferred annuities and institutional products
FIA option costs
Product charges (strategy fees)
Reinsurance embedded derivative impacts
Change in fair values of embedded derivatives - FIAS
Negative VOBA amortization
CRA noncontrolling interest
Other changes in interest sensitive contract liabilities
Total adjustments to arrive at cost of crediting
Cost of crediting
GAAP interest sensitive contract benefits
Interest credited other than deferred annuities and institutional products
FIA option costs
Product charges (strategy fees)
Reinsurance embedded derivative impacts
Change in fair values of embedded derivatives - FIAS
Negative VOBA amortization
ACRA noncontrolling interest
Other changes in interest sensitive contract liabilities
Total adjustments to arrive at cost of crediting
Cost of crediting
Consolidated average net invested assets ex. Apollo investment
APOLLO INVESTOR DAY 2021
RECONCILIATION OF INTEREST SENSITIVE CONTRACT BENEFITS TO COST OF CREDITING
Quarterly
$
$
3Q'18
742
14
231
(25)
29
(546)
5
3
(289)
453
2.98%
0.05%
0.93%
-0.10%
0.12%
-2.19%
0.02%
0.00%
0.01%
-1.16%
1.82%
$ 99,603
$
$
4Q'18
(825)
35
275
(28)
14
1,039
9
(3)
1,341
516 $
-3.02%
0.13%
1.01%
-0.10%
0.05%
3.80%
0.03%
0.00%
-0.01%
4.91%
1.89%
$
$ 109,423
1Q'19
1,516
55
278
(28)
15
(1,311)
12
(2)
(981)
535 $
5.39%
0.20%
0.99%
-0.10%
0.05%
-4.66%
0.04%
0.00%
-0.01%
-3.49%
1.90%
$
$ 112,402
2Q'19
1,094
50
280
(29)
14
(868)
7
(1)
(547)
547
3.80%
0.17%
0.97%
-0.10%
0.05%
-3.01%
0.02%
0.00%
0.00%
-1.90%
1.90%
$ 115,221
$
$
3Q'19
801
63
282
(31)
14
(560)
9
(225)
576 $
2.69%
0.21%
0.95%
-0.10%
0.05%
-1.88%
0.03%
0.00%
-0.01%
-0.75%
1.94%
$
118,905
4Q'19
1,146
64
269
(31)
14
(905)
8
(42)
(2)
(625)
521 $
3.95%
0.22%
0.93%
-0.11%
0.05%
-3.12%
0.03%
-0.14%
-0.01%
-2.15%
1.80%
1Q'20
2Q'20
$ (1,319) $ 2,076
63
75
266
271
(34)
(32)
14
15
$ 115,986
1,504
7
38
(1)
1,859
540
-4.44%
0.21%
0.90%
-0.11%
0.05%
5.06%
0.02%
0.13%
0.00%
6.26%
1.82%
$ 118,919
$
(1,734)
5
(113)
(1)
(1,516)
560
6.56%
0.24%
0.86%
-0.11%
0.05%
-5.48%
0.01%
-0.36%
0.00%
-4.79%
1.77%
$ 126,510
$
$
3Q'20
1,225
73
284
(34)
14
(779)
3
(151)
5
(585)
640
3.53%
0.21%
0.82%
-0.10%
0.04%
-2.24%
0.01%
-0.44%
0.01%
-1.69%
1.84%
$ 138,797
$
$
4Q'20
1,909
101
280
(36)
14
(1,395)
6
(207)
5
(1,232)
677
5.26%
0.28%
0.77%
-0.10%
0.04%
-3.84%
0.01%
-0.57%
0.01%
-3.40%
1.86%
$ 145,251
$
$
1Q'21
394
97
279
(38)
14
43
3
(128)
4
274
668
1.04%
0.25%
0.74%
-0.10%
0.04%
0.11%
0.01%
-0.34%
0.01%
0.72%
1.76%
$ 151,644
$
$
2Q'21
1,979
94
278
(40)
12
(1,480)
5
(180)
10
(1,301)
678
5.05%
0.24%
0.71%
-0.10%
0.03%
-3.78%
0.01%
-0.46%
0.03%
-3.32%
1.73%
$ 156,753View entire presentation