KLA Investor Day Presentation Deck
Reconciliation of Free Cash Flow and Related Metrics
Free Cash Flow Measures
(Dollars in thousands)
Net cash provided by operating activities
Less Capital expenditures
Free cash flow
Free cash flow
Revenue
Free cash flow margin
Mar 31, 2022 Dec 31, 2021
$ 2,959,095 $ 2,786,367
(289,535)
(250,414)
$ 2,669,560
$ 2,535,953
$ 2,669,560
$ 8,650,615
30.9%
$ 2,535,953
$ 8,165,712
31.1%
Dec 31, 2020
$ 1,968,126
(200,304)
$ 1,767,822
$ 1,767,822
$ 6,073,047
29.1%
Dec 31, 2019
$ 1,373,031
(149,242)
$ 1,223,789
$ 1,223,789
$ 5,278,613
23.2%
For the twelve months ended
Dec 31, 2018 Dec 31, 2017
$ 1,389,697 $ 1,190,475
(86,518) (49,207)
$ 1,303,179
$ 1,141,268
$ 1,303,179
$ 4,304,456
30.3%
$ 1,141,268
$ 3,797,859
30.1%
Dec 31, 2016 Dec 31, 2015 Dec 31, 2014 Dec 31, 2013 Dec 31, 2012
$ 857,780
854,002 $ 532,377 S 882,871 $
(34,974) (34,842) (57,514) (73,426)
$ 822,806 $ 819,160
474,863
809,445
S 822,806
$ 3,259,162
25.2%
$ 819,160
$ 2,847,680
28.8%
$
$
$
859,396
(67,913)
791,483
S 474,863 S
809,445 S 791,483
$ 2,885,200 $ 2,812,527 $ 3,126,706
16.5%
28.8%
25.3%
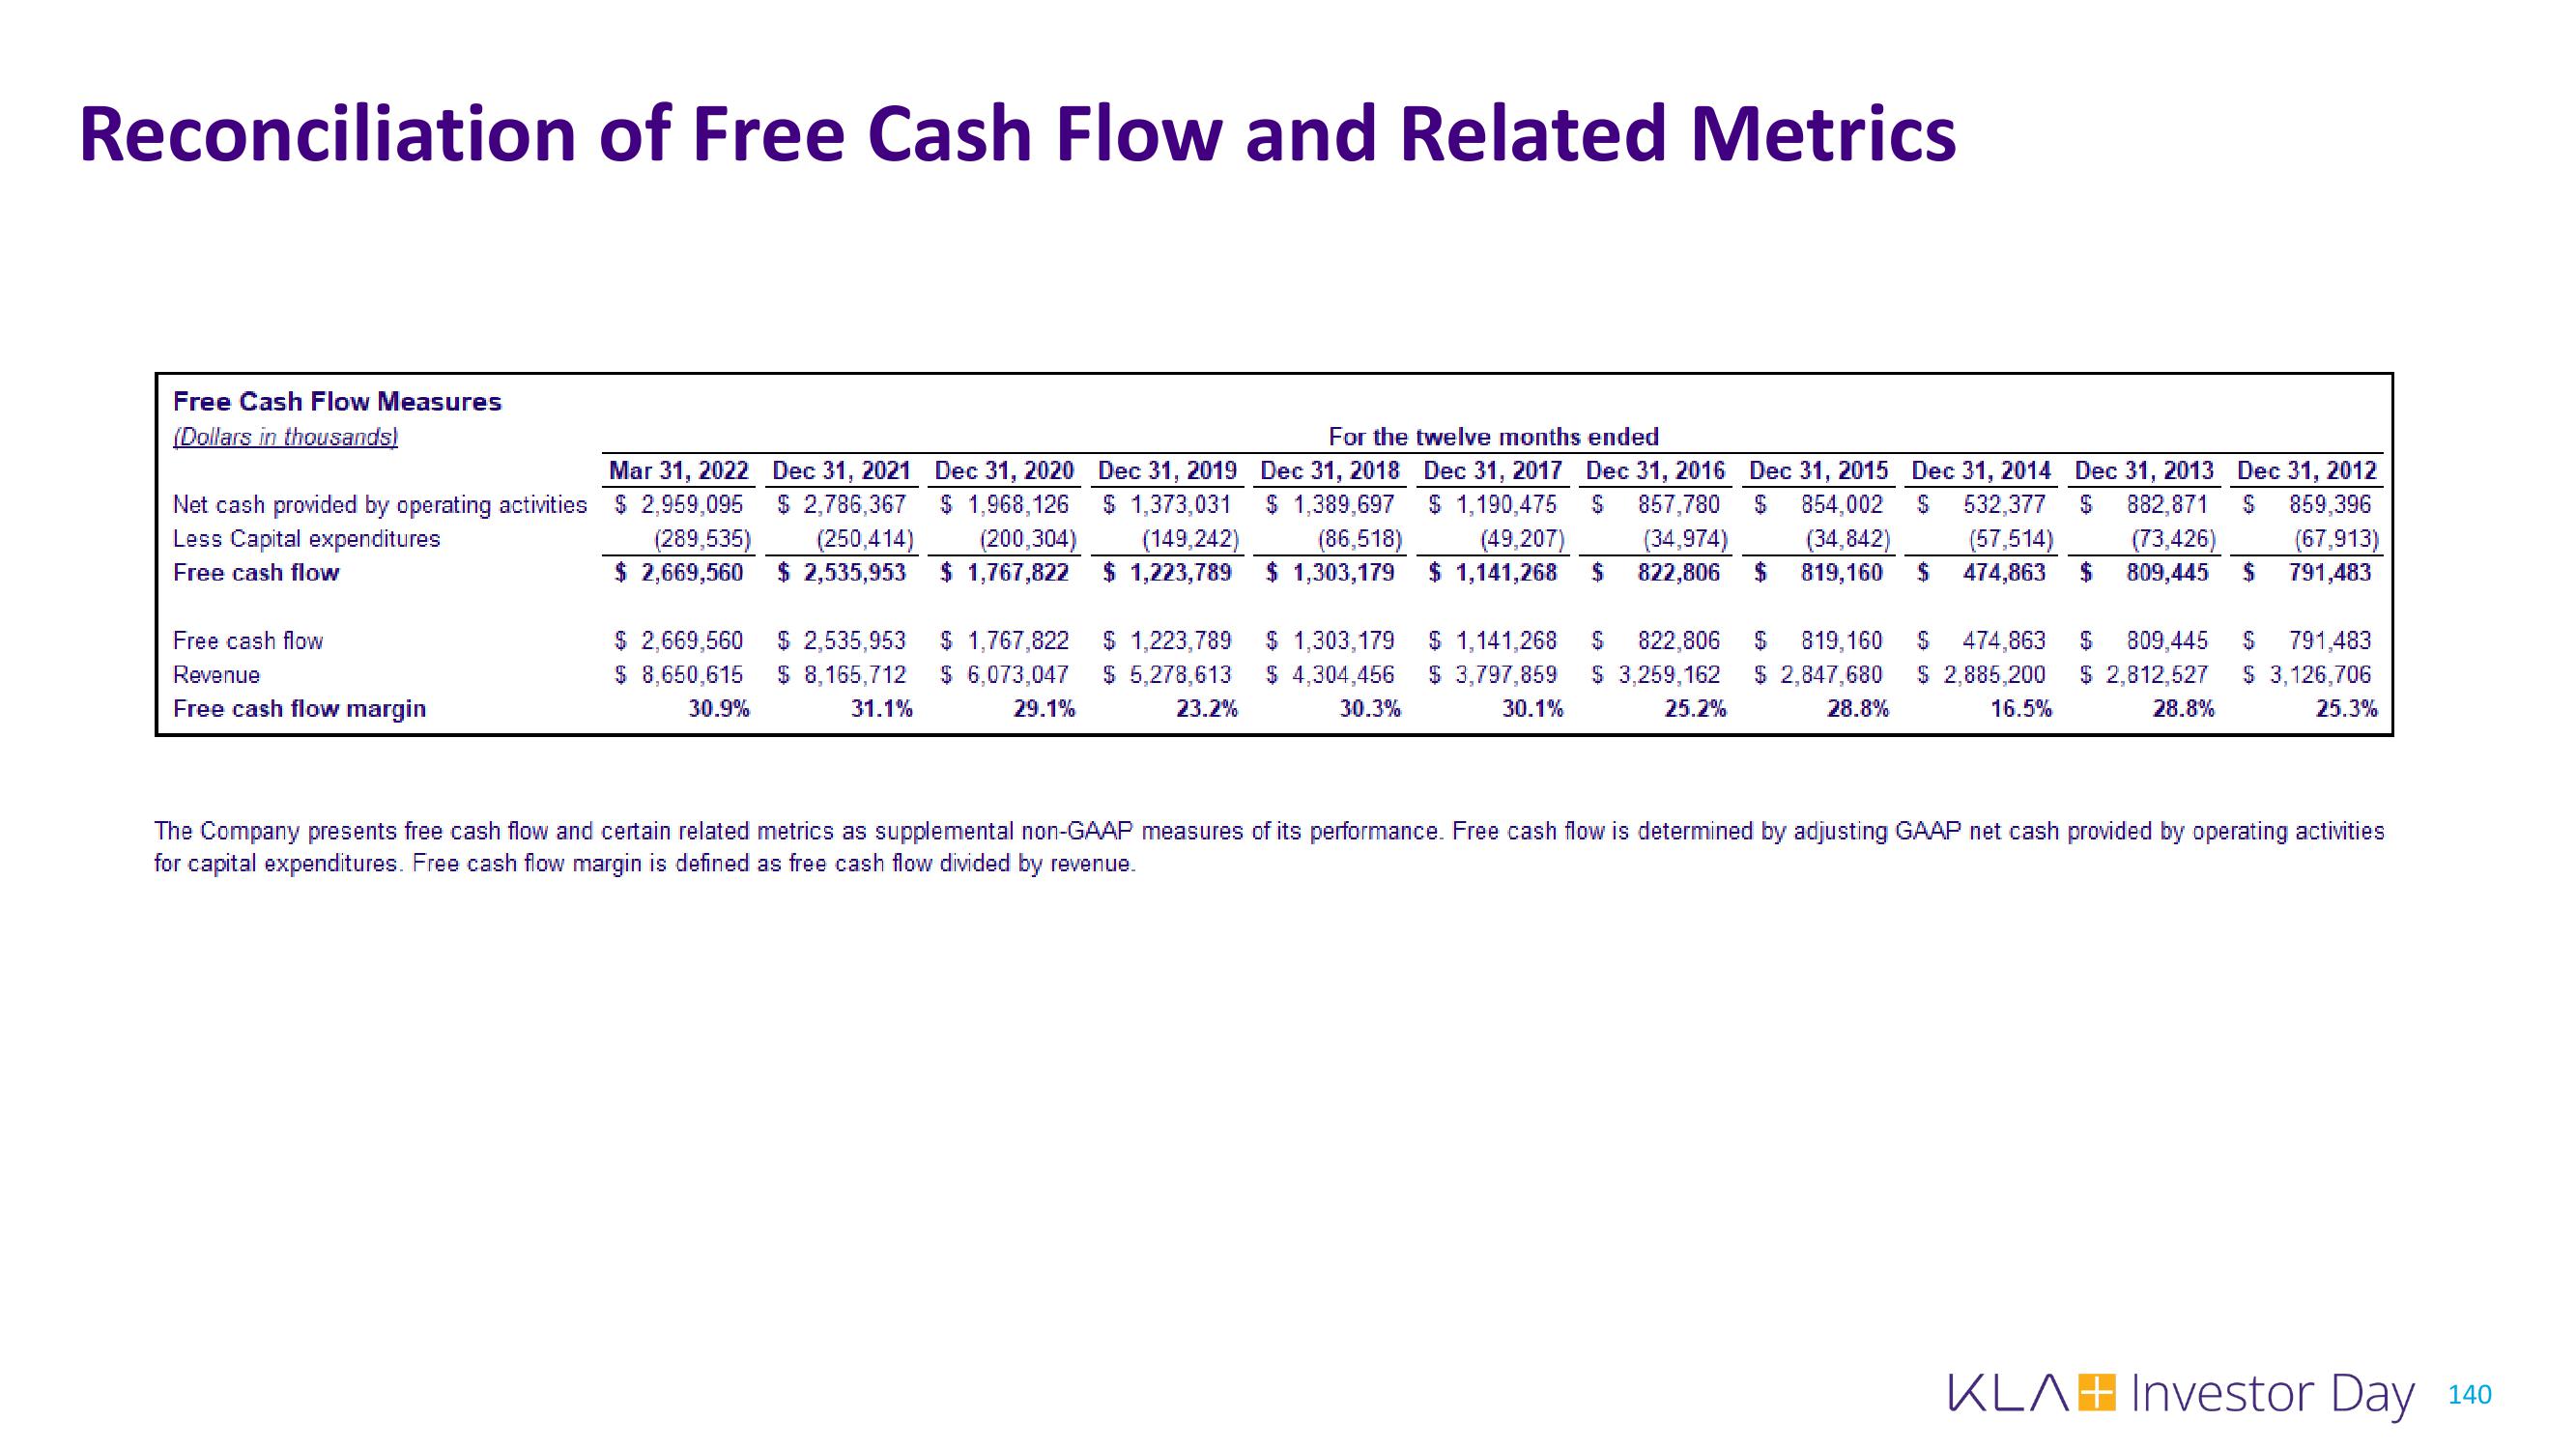
The Company presents free cash flow and certain related metrics as supplemental non-GAAP measures of its performance. Free cash flow is determined by adjusting GAAP net cash provided by operating activities
for capital expenditures. Free cash flow margin is defined as free cash flow divided by revenue.
KLA# Investor Day 140View entire presentation