Apollo Global Management Investor Day Presentation Deck
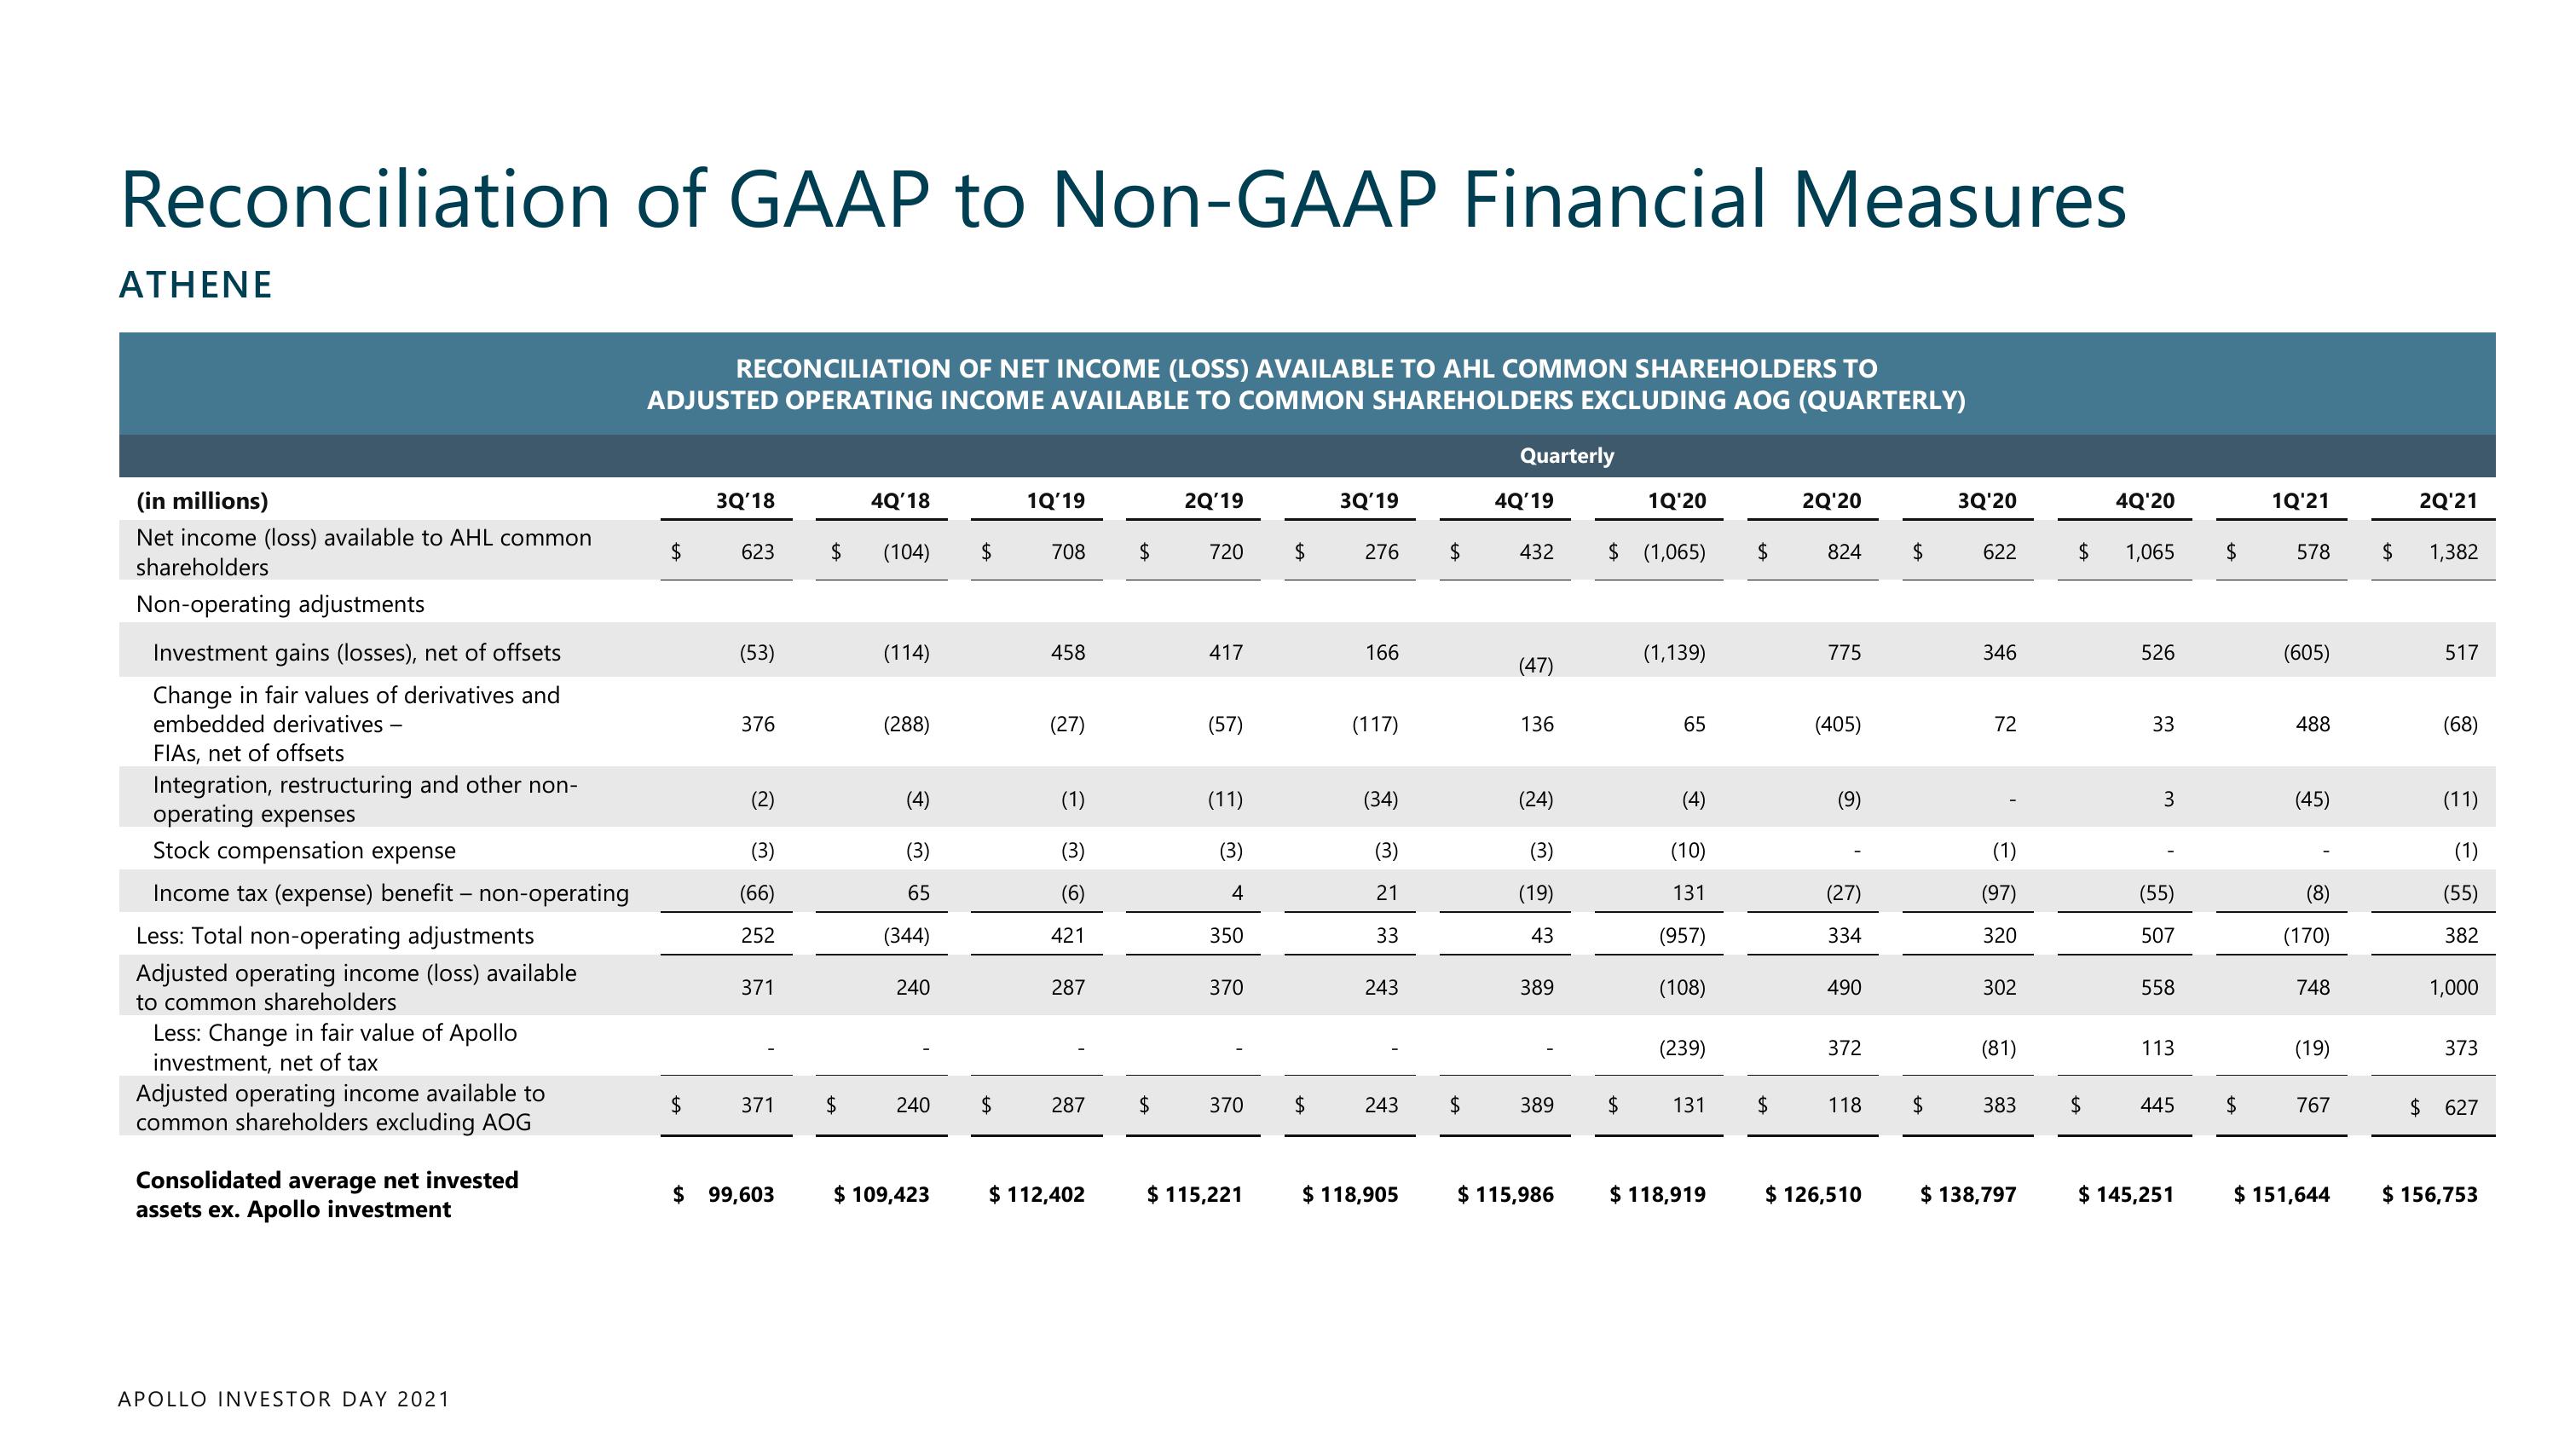
Reconciliation of GAAP to Non-GAAP Financial Measures
ATHENE
(in millions)
Net income (loss) available to AHL common
shareholders
Non-operating adjustments
Investment gains (losses), net of offsets
Change in fair values of derivatives and
embedded derivatives -
FIAS, net of offsets
Integration, restructuring and other non-
operating expenses
Stock compensation expense
Income tax (expense) benefit - non-operating
Less: Total non-operating adjustments
Adjusted operating income (loss) available
to common shareholders
Less: Change in fair value of Apollo
investment, net of tax
Adjusted operating income available to
common shareholders excluding AOG
Consolidated average net invested
assets ex. Apollo investment
APOLLO INVESTOR DAY 2021
RECONCILIATION OF NET INCOME (LOSS) AVAILABLE TO AHL COMMON SHAREHOLDERS TO
ADJUSTED OPERATING INCOME AVAILABLE TO COMMON SHAREHOLDERS EXCLUDING AOG (QUARTERLY)
$
$
3Q'18
623
(53)
376
(2)
(3
(66)
252
371
$
371 $
$ 99,603
4Q'18
(104)
(114)
(288)
(4)
(3)
65
(344)
240
240
$ 109,423
$
$
1Q'19
708
458
(27)
(1)
(3)
(6)
421
287
287
$ 112,402
$
$
2Q'19
720 $
417
(57)
(11)
(3)
4
350
370
370
$ 115,221
$
3Q'19
276
166
(117)
(34)
(3
21
33
243
243
$ 118,905
$
$
Quarterly
4Q'19
432
(47)
136
(24)
(3)
(19)
43
389
389
$ 115,986
1Q'20
$ (1,065)
$
(1,139)
65
(4)
(10)
131
(957)
(108)
(239)
131
$ 118,919
$
$
2Q'20
824 $
775
(405)
(9)
(27)
334
490
372
118
$ 126,510
$
3Q'20
622
346
72
(1)
(97)
320
302
(81)
383
$ 138,797
$
4Q'20
1,065
526
33
3
(55)
507
558
113
445
$ 145,251
$
$
1Q'21
578
(605)
488
(45)
(8)
(170)
748
(19)
767
$ 151,644
2Q'21
$
LA
1,382
517
(68)
(11)
(1)
(55)
382
1,000
373
627
$ 156,753View entire presentation