Nexters Investor Presentation Deck
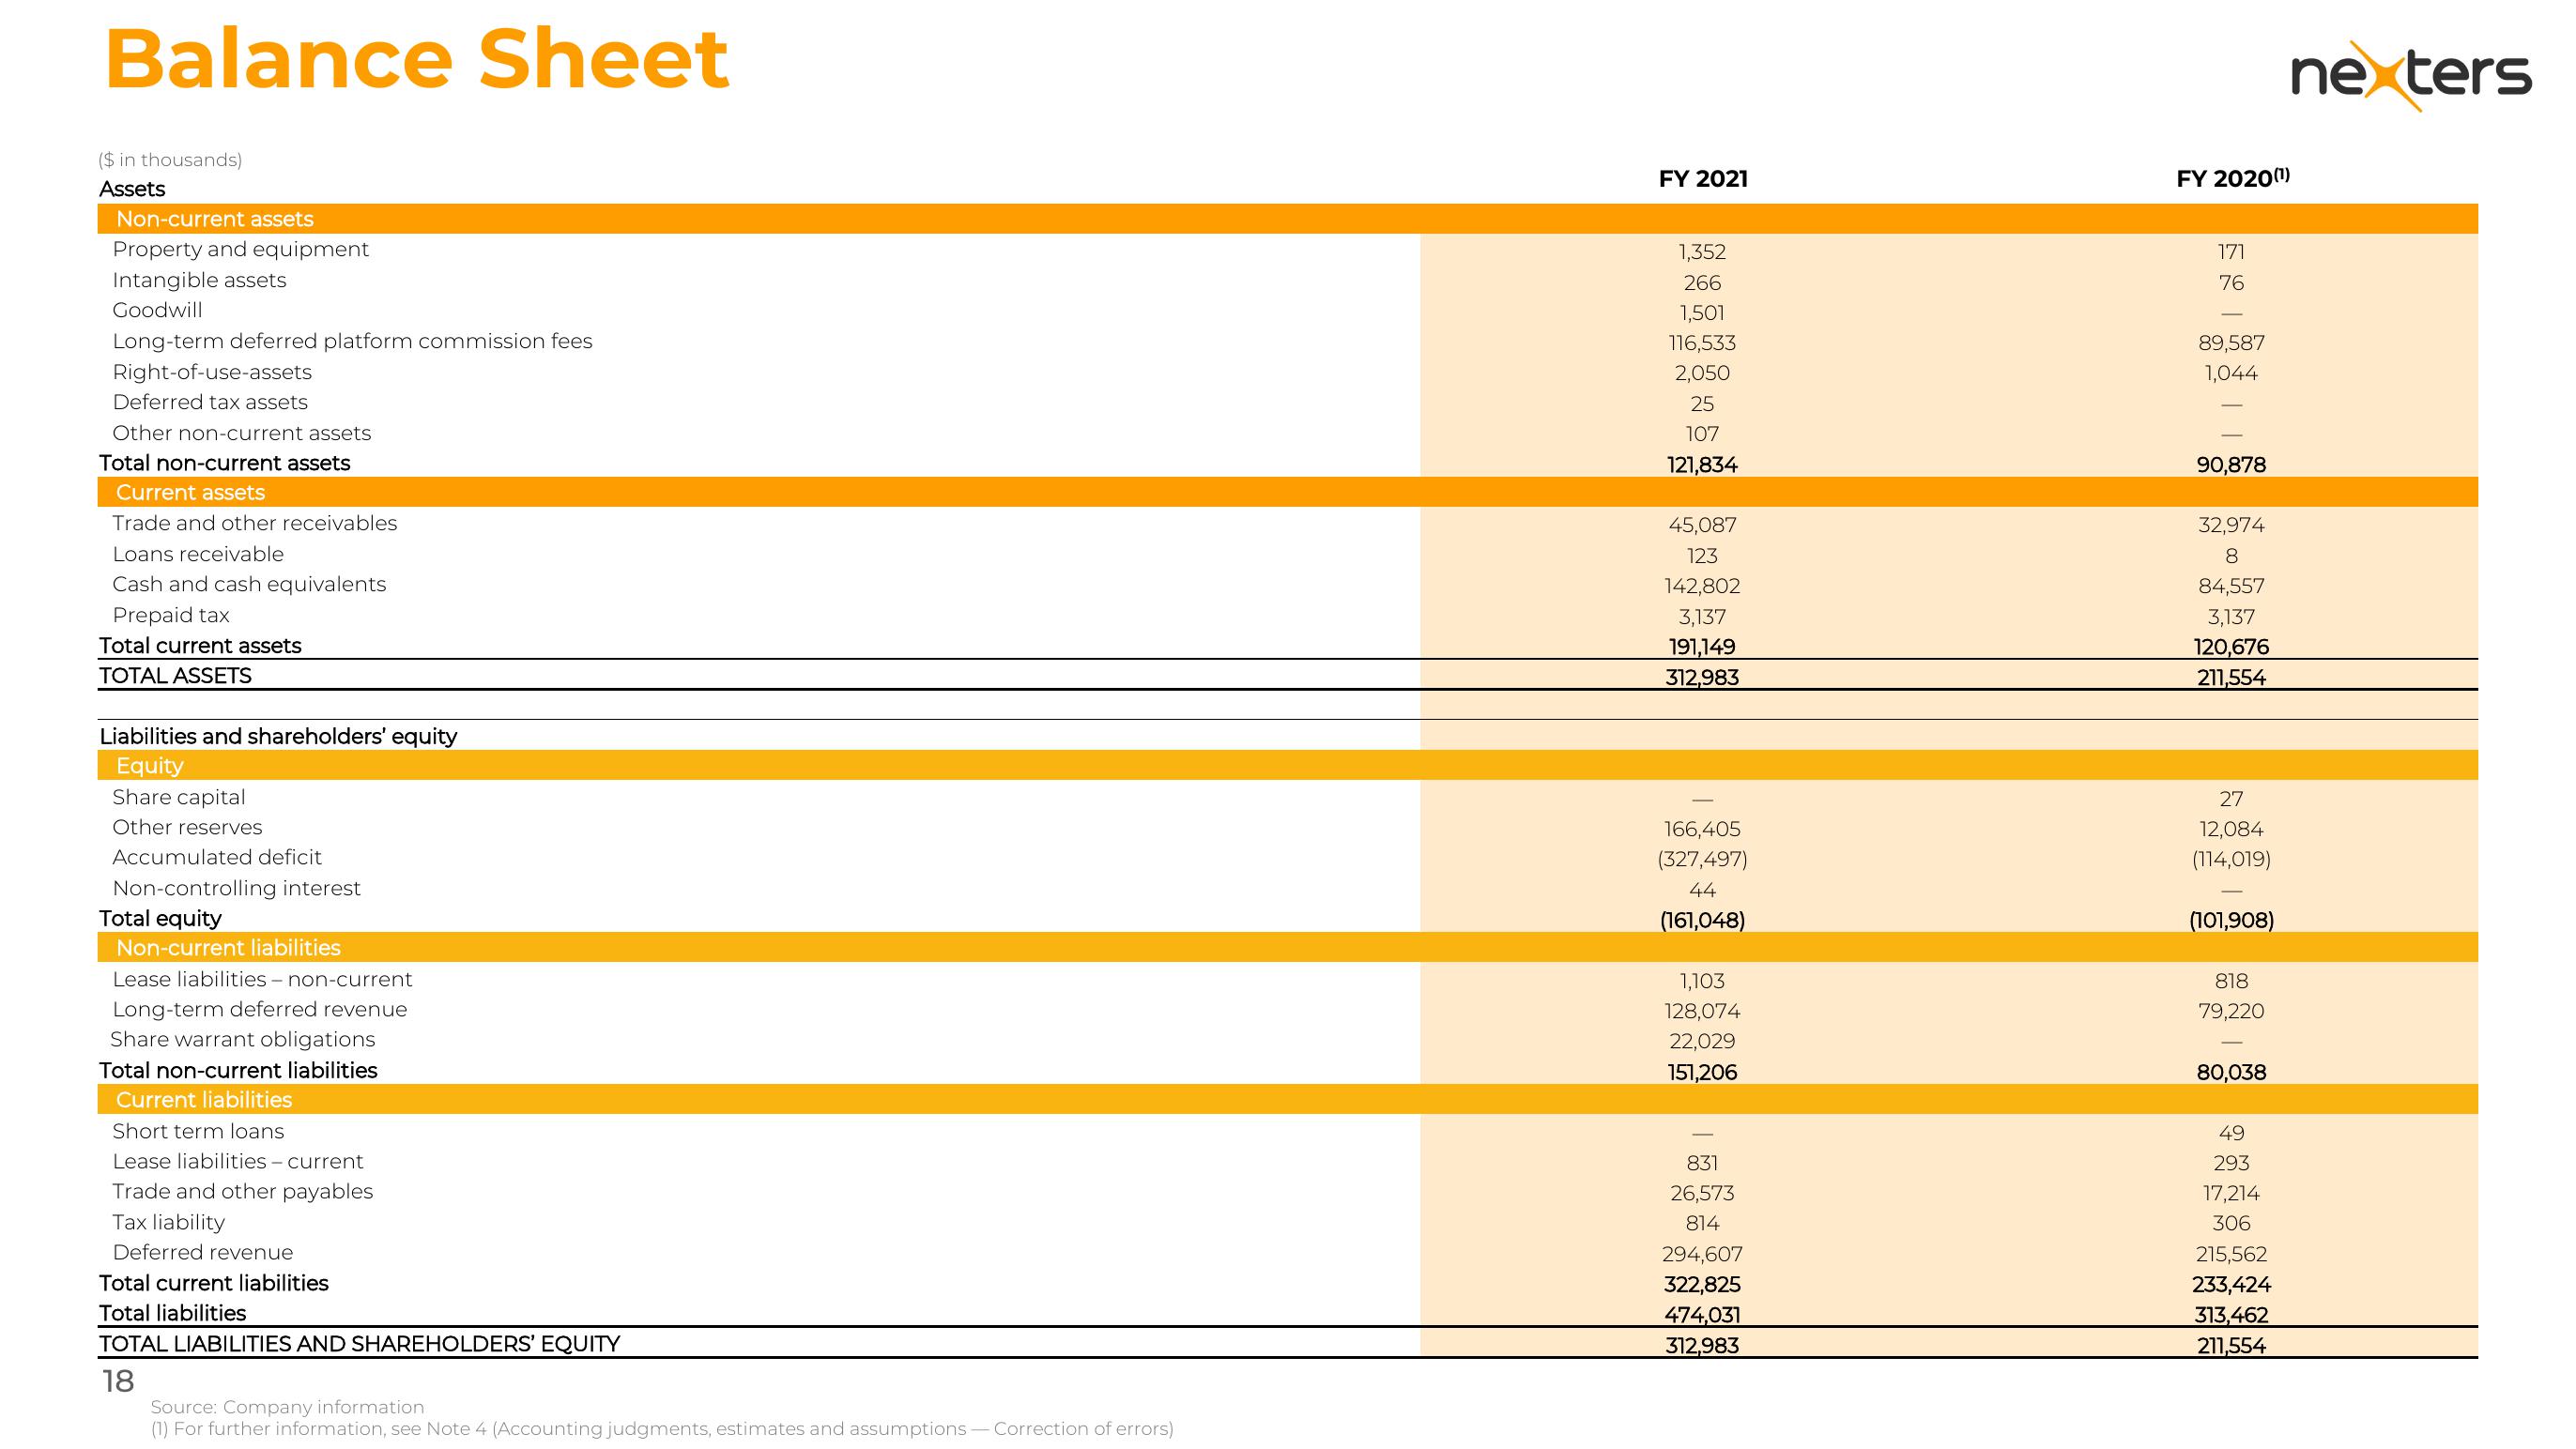
Balance Sheet
($ in thousands)
Assets
Non-current assets
Property and equipment
Intangible assets
Goodwill
Long-term deferred platform commission fees
Right-of-use-assets
Deferred tax assets
Other non-current assets
Total non-current assets
Current assets
Trade and other receivables
Loans receivable
Cash and cash equivalents
Prepaid tax
Total current assets
TOTAL ASSETS
Liabilities and shareholders' equity
Equity
Share capital
Other reserves
Accumulated deficit
Non-controlling interest
Total equity
Non-current liabilities
Lease liabilities - non-current
Long-term deferred revenue
Share warrant obligations
Total non-current liabilities
Current liabilities
Short term loans
Lease liabilities - current
Trade and other payables
Tax liability
Deferred revenue
Total current liabilities
Total liabilities
TOTAL LIABILITIES AND SHAREHOLDERS' EQUITY
18
Source: Company information
(1) For further information, see Note 4 (Accounting judgments, estimates and assumptions - Correction of errors)
FY 2021
1,352
266
1,501
116,533
2,050
25
107
121,834
45,087
123
142,802
3,137
191,149
312,983
166,405
(327,497)
44
(161,048)
1,103
128,074
22,029
151,206
831
26,573
814
294,607
322,825
474,031
312,983
FY 2020 (¹)
171
76
89,587
1,044
90,878
32,974
8
84,557
3,137
120,676
211,554
27
12,084
(114,019)
(101,908)
818
79,220
80,038
49
293
17,214
306
nex ters
215,562
233,424
313,462
211,554View entire presentation