Broadridge Financial Solutions Results Presentation Deck
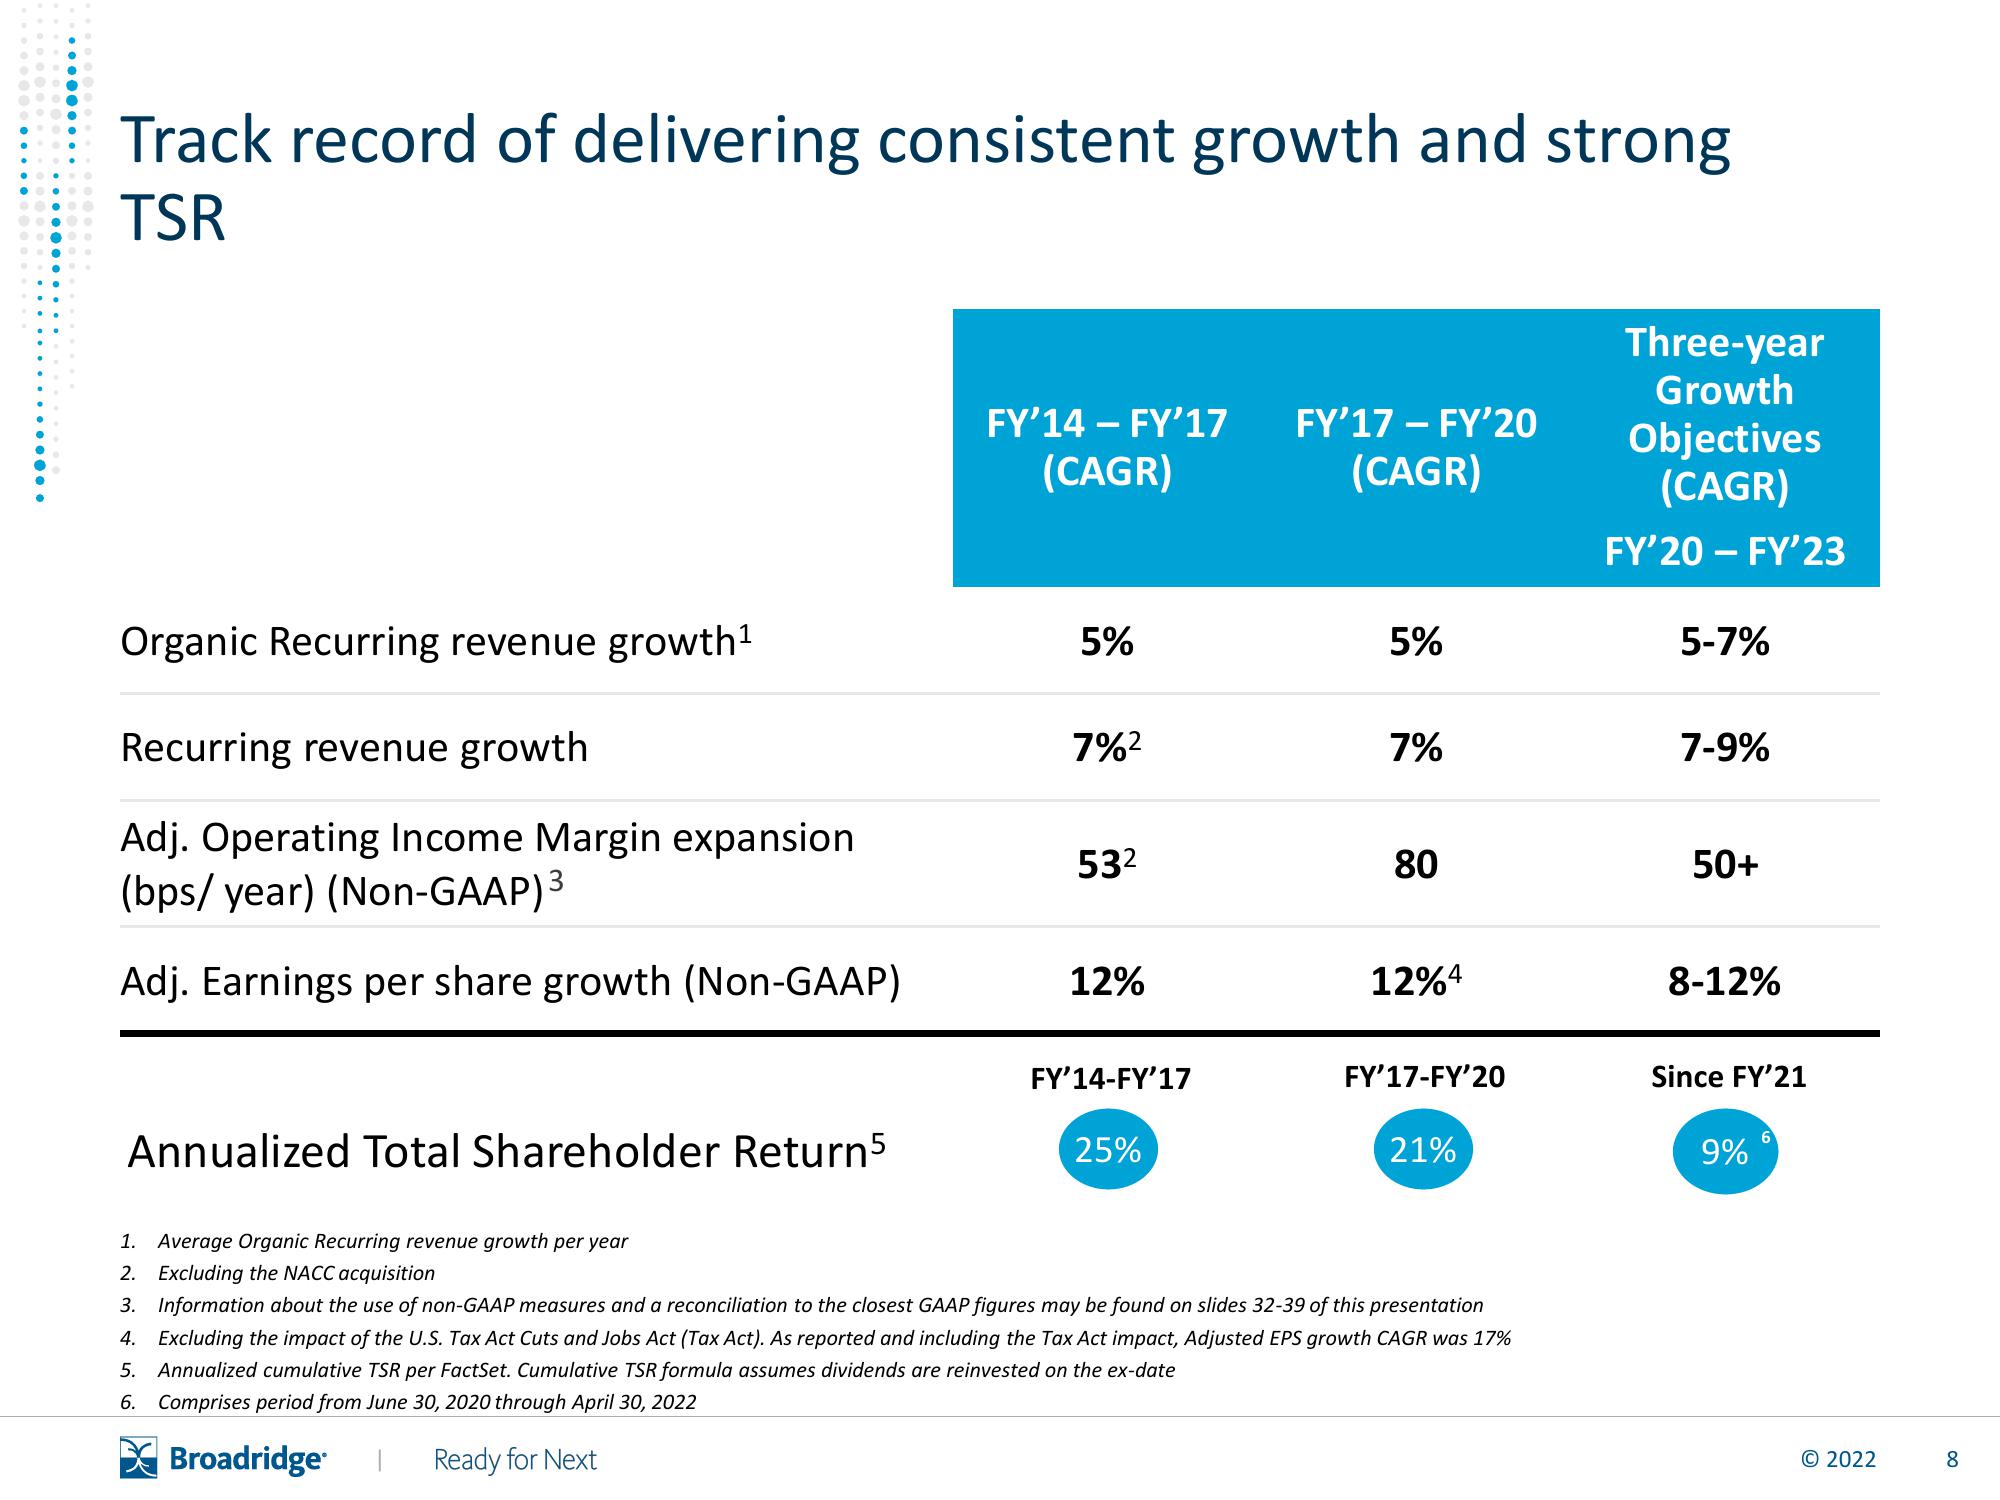
Track record of delivering consistent growth and strong
TSR
Organic Recurring revenue growth¹
Recurring revenue growth
Adj. Operating Income Margin expansion
(bps/year) (Non-GAAP) ³
Adj. Earnings per share growth (Non-GAAP)
Annualized Total Shareholder Return5
FY'14 - FY'17 FY'17- FY'20
(CAGR)
(CAGR)
5%
7%²
53²
12%
FY'14-FY'17
25%
5%
7%
80
12%4
FY'17-FY'20
21%
1. Average Organic Recurring revenue growth per year
2. Excluding the NACC acquisition
3. Information about the use of non-GAAP measures and a reconciliation to the closest GAAP figures may be found on slides 32-39 of this presentation
4. Excluding the impact of the U.S. Tax Act Cuts and Jobs Act (Tax Act). As reported and including the Tax Act impact, Adjusted EPS growth CAGR was 17%
5. Annualized cumulative TSR per FactSet. Cumulative TSR formula assumes dividends are reinvested on the ex-date
6. Comprises period from June 30, 2020 through April 30, 2022
Broadridge I Ready for Next
Three-year
Growth
Objectives
(CAGR)
FY'20 - FY'23
5-7%
7-9%
50+
8-12%
Since FY'21
9%
© 2022
8View entire presentation