JD Sports Results Presentation Deck
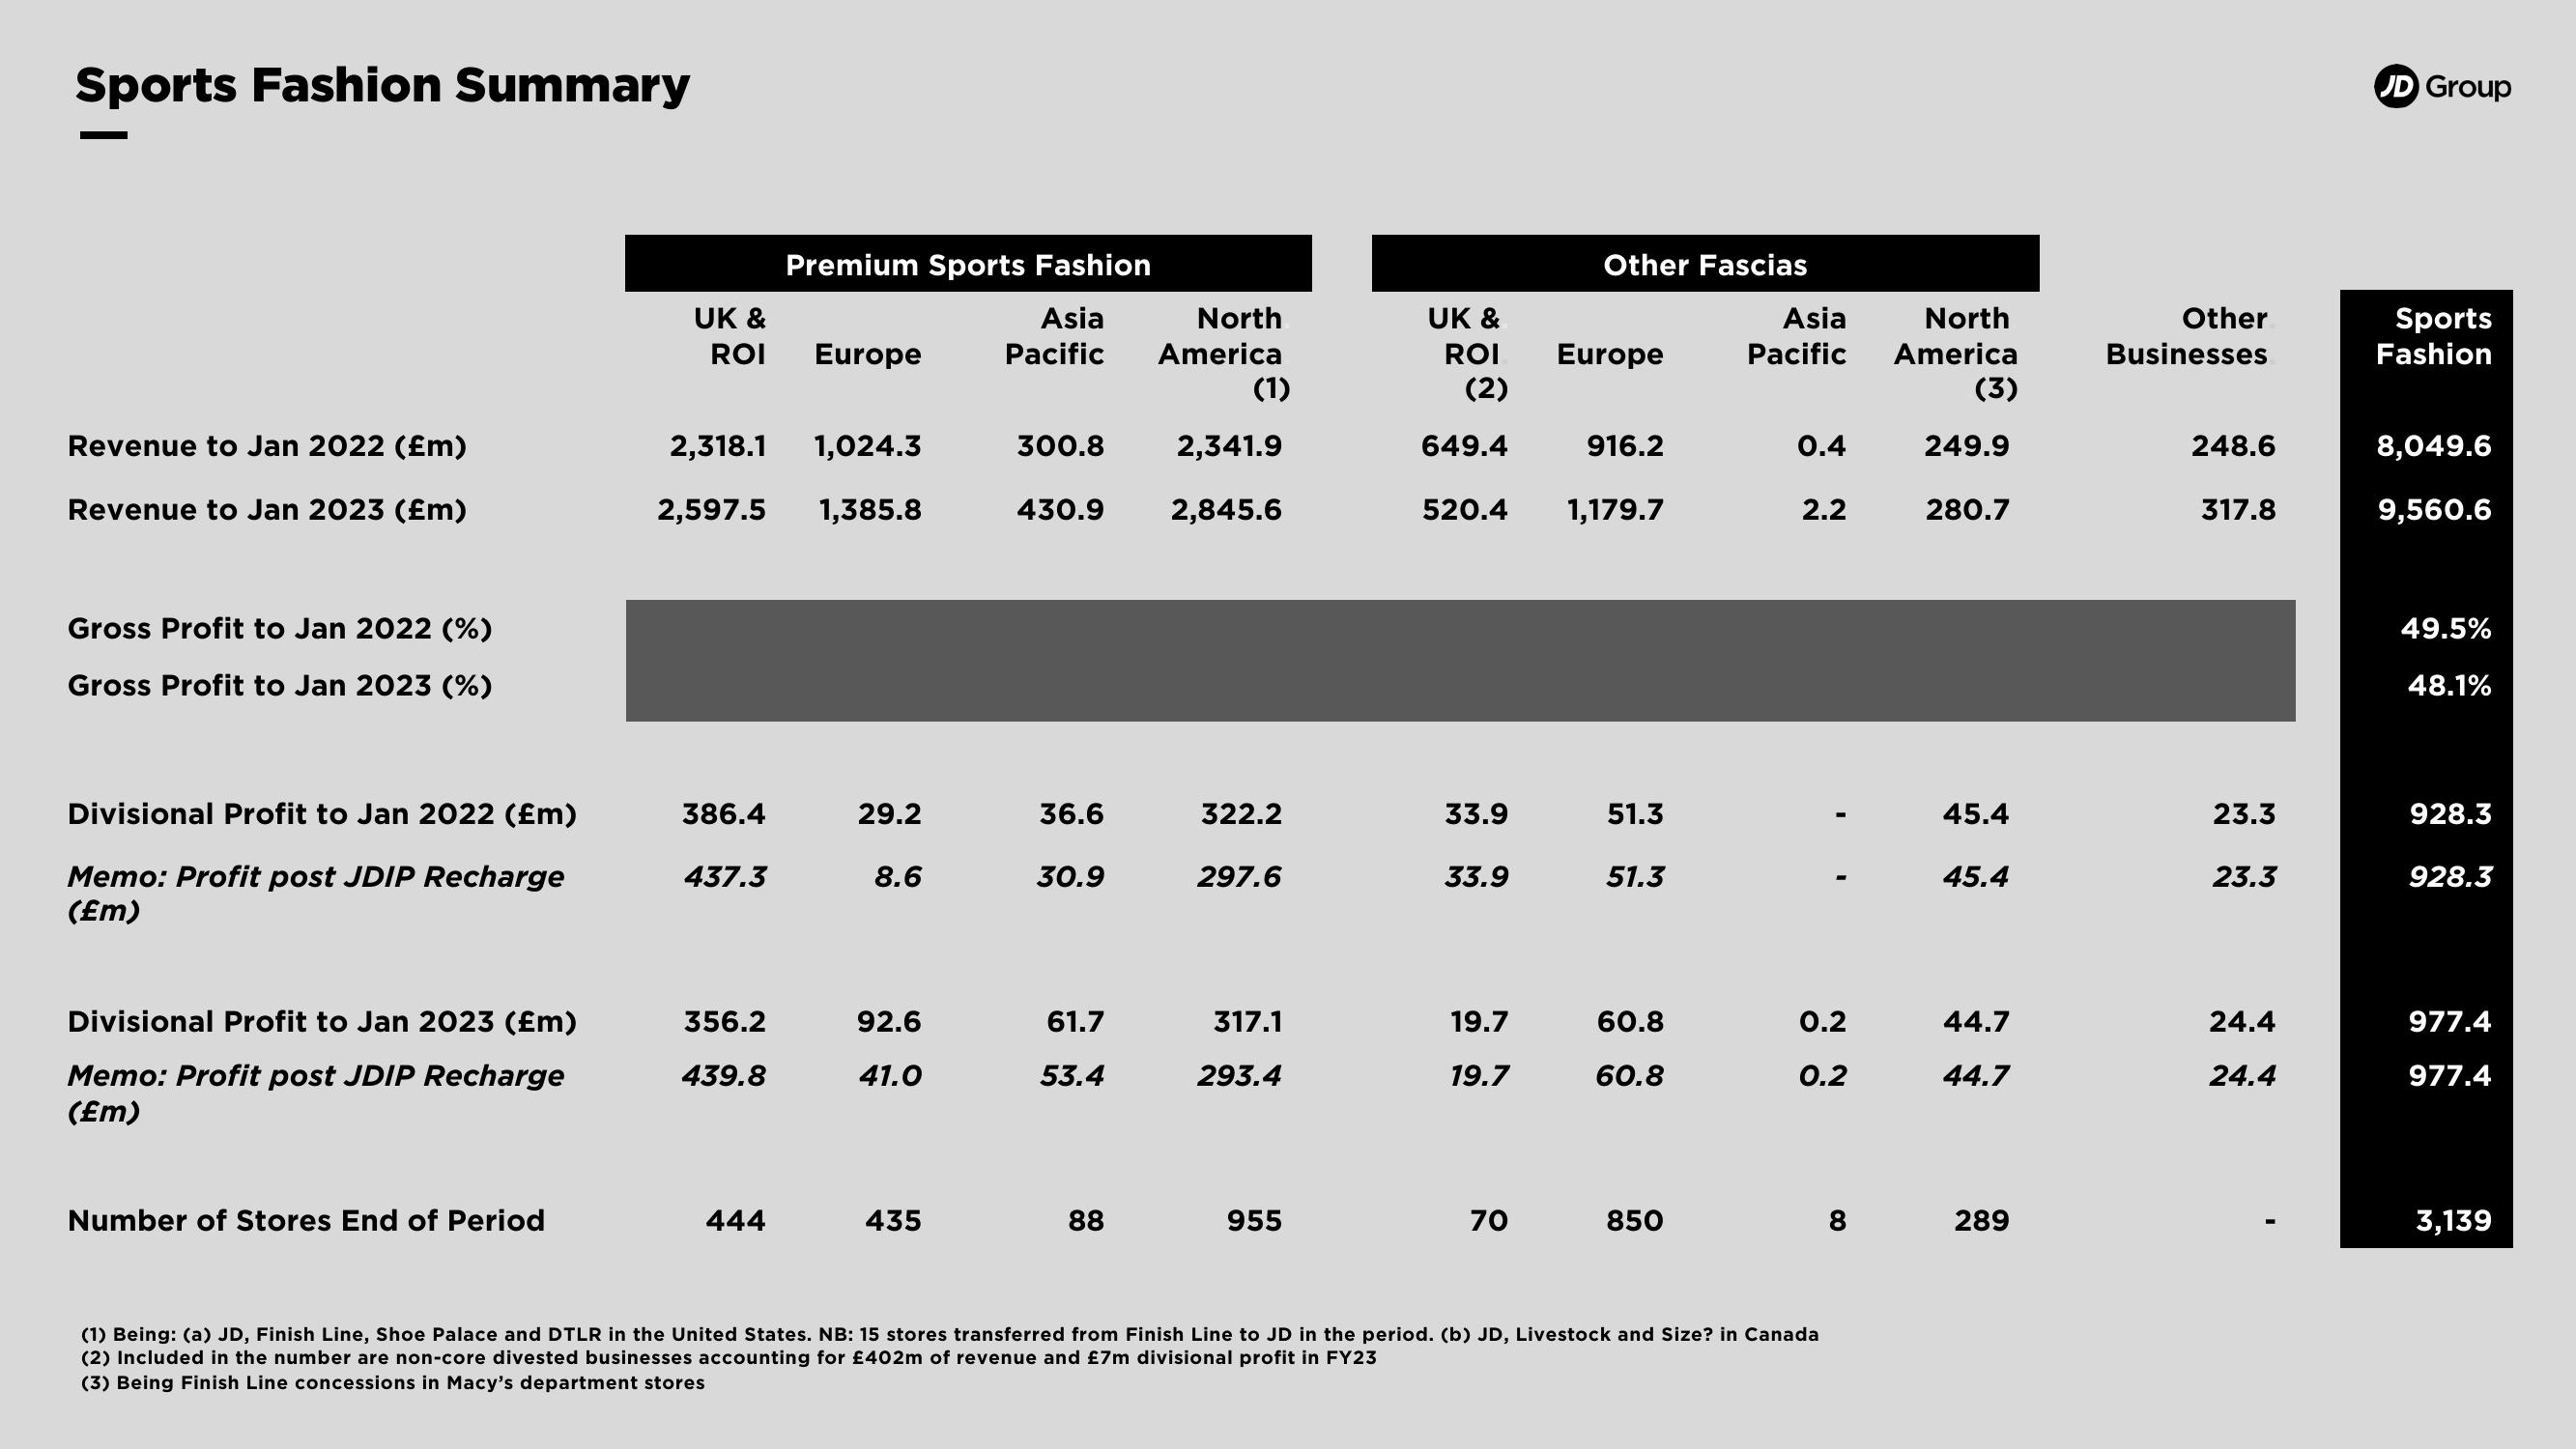
Sports Fashion Summary
Revenue to Jan 2022 (£m)
Revenue to Jan 2023 (Em)
Gross Profit to Jan 2022 (%)
Gross Profit to Jan 2023 (%)
Divisional Profit to Jan 2022 (£m)
Memo: Profit post JDIP Recharge
(£m)
Divisional Profit to Jan 2023 (£m)
Memo: Profit post JDIP Recharge
(£m)
Number of Stores End of Period
UK &
ROI
386.4
437.3
2,318.1 1,024.3
2,597.5 1,385.8
356.2
439.8
Premium Sports Fashion
Asia
Pacific
444
Europe
29.2
8.6
92.6
41.0
435
300.8
430.9
36.6
30.9
61.7
53.4
88
North
America
(1)
2,341.9
2,845.6
322.2
297.6
317.1
293.4
955
UK &
ROI
(2)
649.4
520.4
33.9
33.9
19.7
19.7
70
Other Fascias
Europe
916.2
1,179.7
51.3
51.3
60.8
60.8
850
Asia North
Pacific America
(3)
249.9
0.4
2.2
0.2
0.2
(1) Being: (a) JD, Finish Line, Shoe Palace and DTLR in the United States. NB: 15 stores transferred from Finish Line to JD in the period. (b) JD, Livestock and Size? in Canada
(2) Included in the number are non-core divested businesses accounting for £402m of revenue and £7m divisional profit in FY23
(3) Being Finish Line concessions in Macy's department stores
8
280.7
45.4
45.4
44.7
44.7
289
Other
Businesses
248.6
317.8
23.3
23.3
24.4
24.4
JD Group
Sports
Fashion
8,049.6
9,560.6
49.5%
48.1%
928.3
928.3
977.4
977.4
3,139View entire presentation