KLA Investor Day Presentation Deck
Reconciliation of Non-GAAP Financial Measures
*
(Dollars in thousands)
GAAP gross profit
Adjustments to reconcile GAAP gross profit to non-GAAP gross profit*
Acquisition-related charges
Restructuring, severance and other charges
Merger-related charges
Non-GAAP gross profit
GAAP gross margin
Non-GAAP gross margin
Restructuring, severance and other charges
Debt extinguishment loss and recapitalization charges
Goodwill and intangible asset impairment
Merger-related charges
Restatement-related charges
Non-GAAP Operating income (1)
b
GAAP operating margin
Non-GAAP operating margin
e
GAAP operating income (1)
Adjustments to reconcile GAAP operating income to non-GAAP operating income*
Acquisition-related charges
a
b
C
d
e
Dec 31, 2021 Dec 31, 2020
$ 4,962,056 $ 3,571,050
f
163,038
230
$ 5,125,324
60.8%
62.8%
220,488
4,281
154,074
2,418
$ 3,176,685 $ 1,725,675
38.9%
41.7%
58.8%
61.4%
$3,727,542 $ 3,175,908
214,533
15,869
256,649
$ 3,401,454 $ 2,212,726
Dec 31, 2019 Dec 31, 2018
$ 2,961,024 $ 2,768,223
28.4%
36.4%
214,053
831
56.1%
60.2%
340,318
2,786
3,708
$ 2,771,931
$ 1,385,274 $ 1,686,488
26.2%
32.7%
64.3%
64.4%
21,218
For the twelve months ended
Dec 31, 2016
$ 2,050,652
39.2%
39.7%
Dec 31, 2017
$ 2,405,872
2,471
121
1,192
776
$ 2,410,916 $ 2,054,436
4,268
63.3%
63.5%
$ 1,420,995
4,737
$ 1,728,378 $ 1,707,706 $ 1,435,040
9,308
37.4%
37.8%
62.9%
63.0%
$ 1,168,340
4,383
137
17,051
Dec 31, 2015
$ 1,652,907
35.8%
36.5%
7,737
10,909
67
$ 1,671,620
$
58.0%
58.7%
772,728
12,396
34,861
8,820
$ 1,189,911 $ 828,805
27.1%
29.1%
Dec 31, 2014
$ 1,644,029
$
9,698
600
$
57.0%
57.3%
698,044
15,874
9,815
2,478
$ 1,654,327 $ 1,643,211 $ 1,804,403 $ 1,890,831
726,211
Dec 31, 2013
$ 1,632,744
24.2%
25.2%
7,684
2,783
$
58.1%
58.4%
16,117
7,502
Dec 31, 2012
$ 1,788,754
$ 751,393
727,774 $ 942,377
25.9%
26.7%
15,649
$
57.2%
57.7%
25,066
3,134
Dec 31, 2011
$ 1,868,376
20,830
1,625
30.1%
31.0%
59.0%
59.7%
$ 1,069,600
30,382
5,947
6,769
970,577 $ 1,112,698
33.8%
35.2%
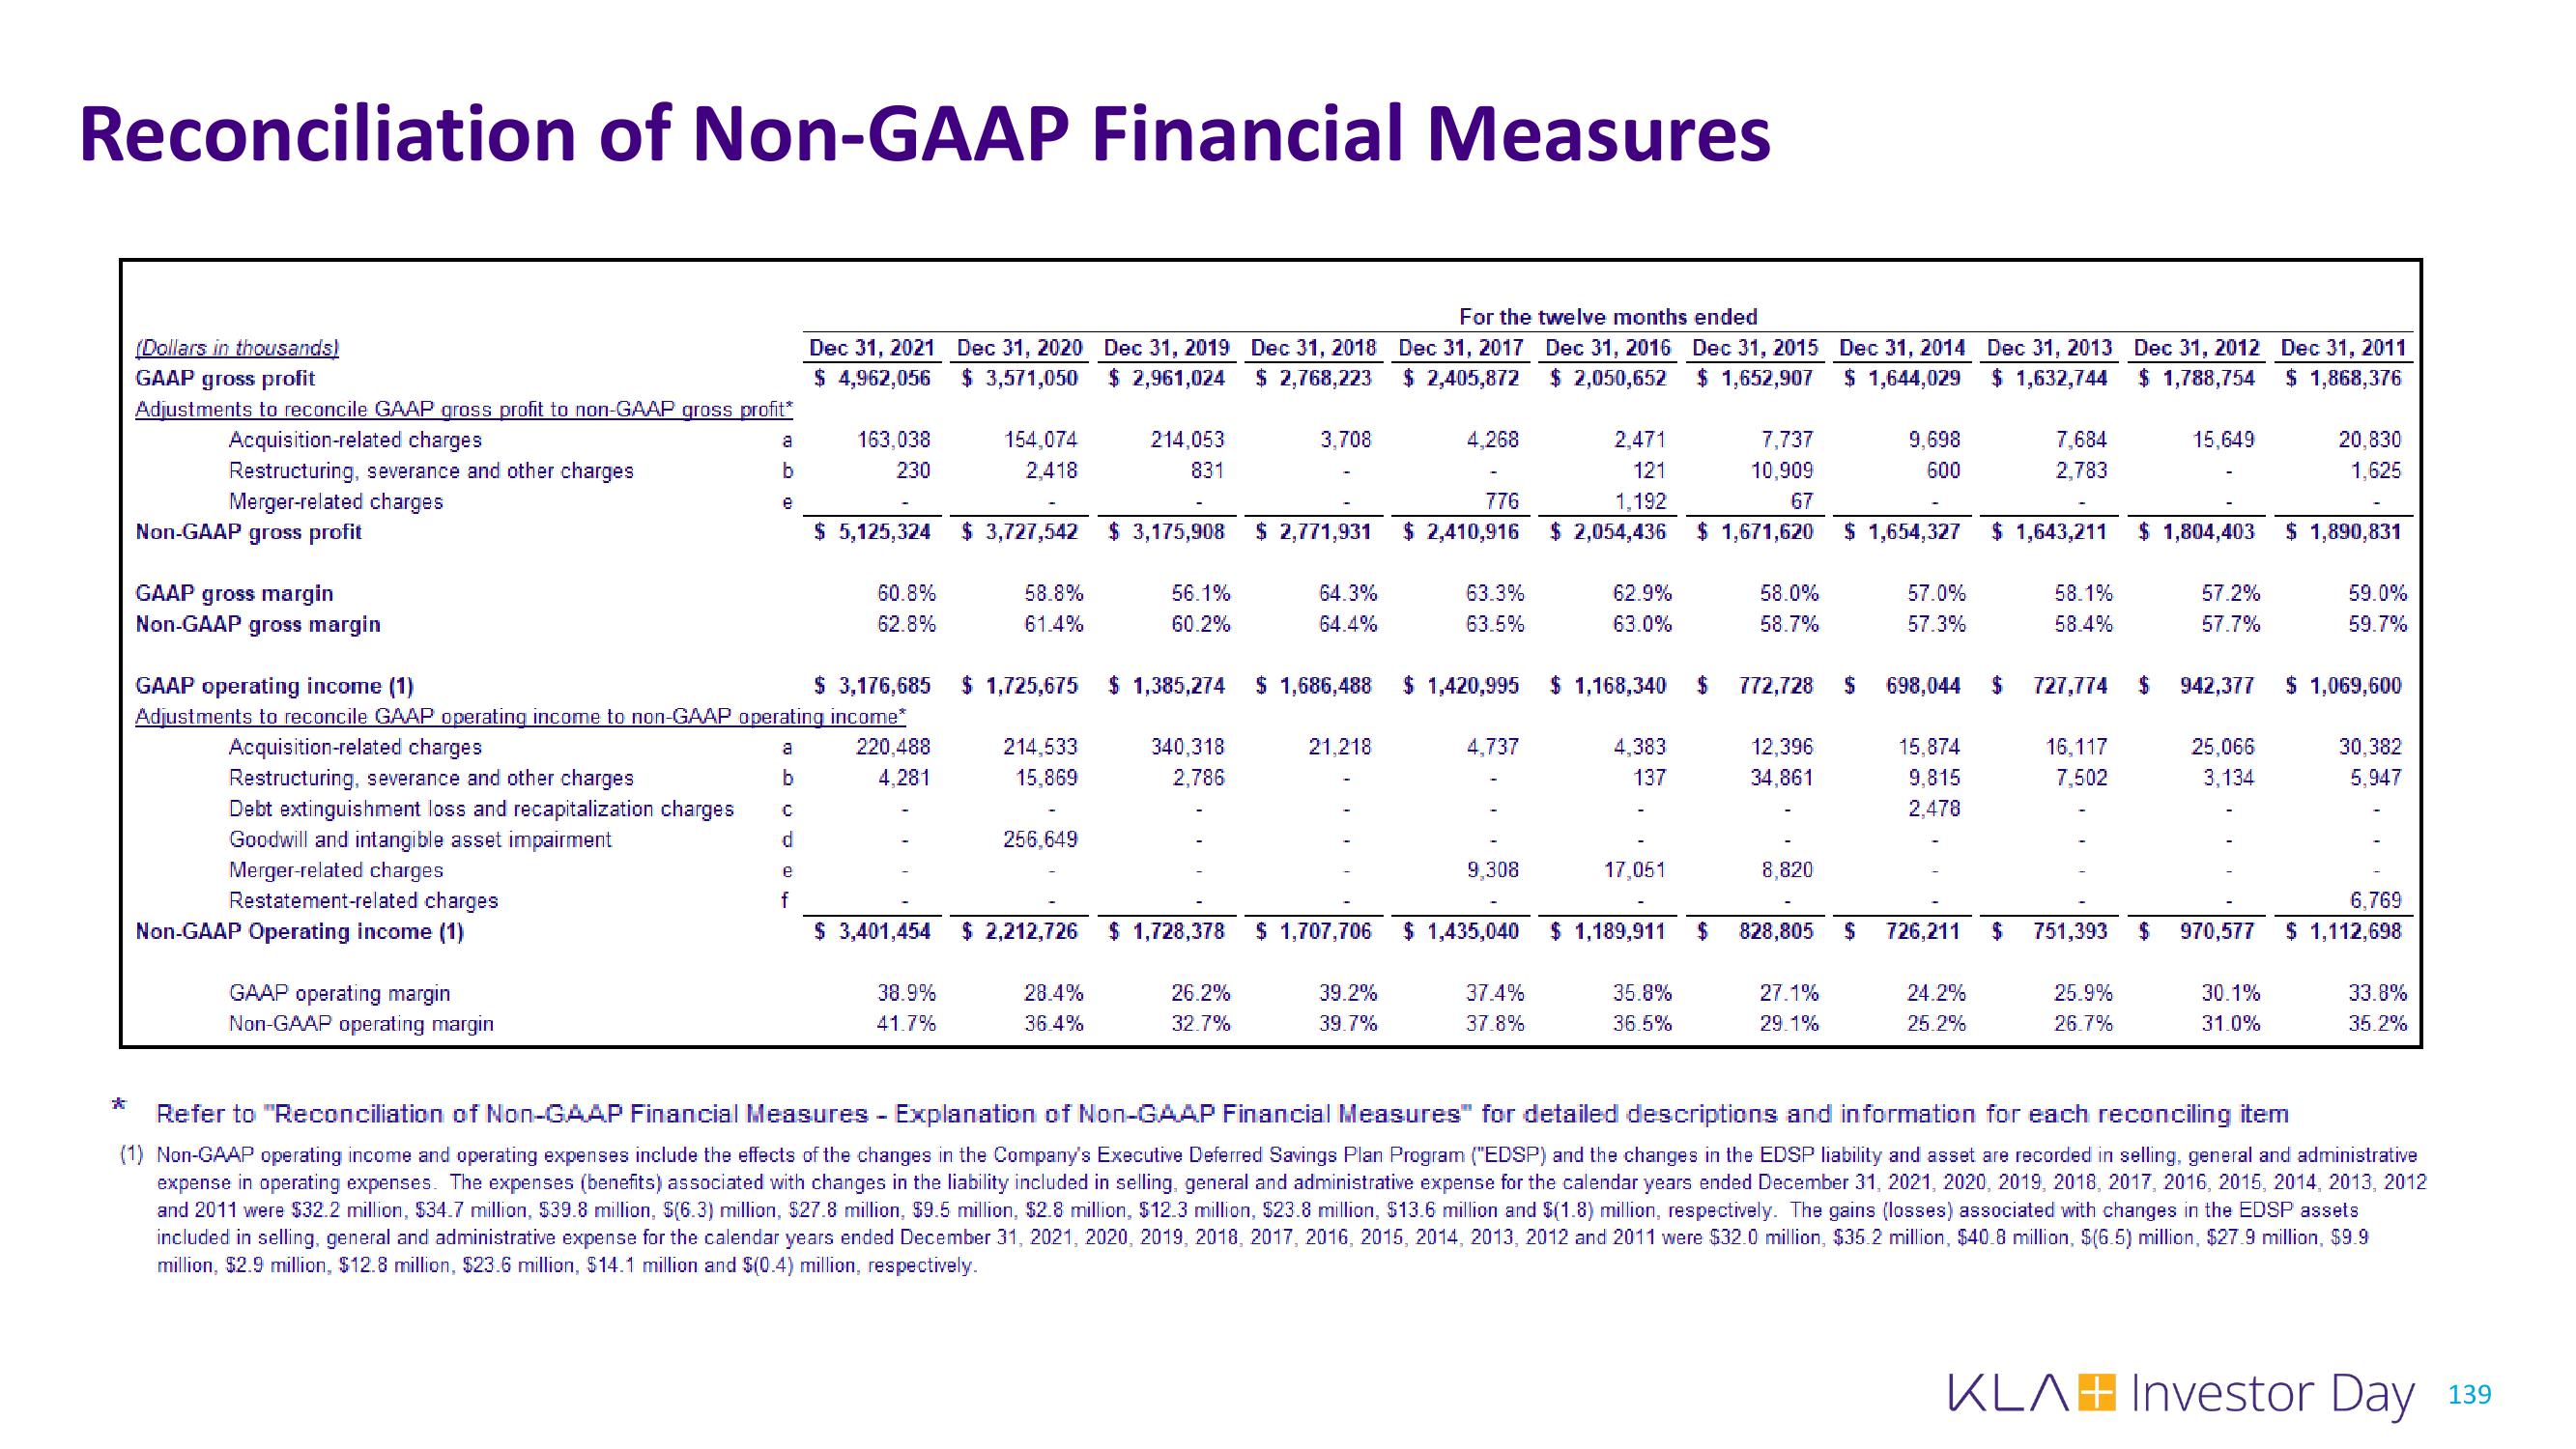
Refer to "Reconciliation of Non-GAAP Financial Measures - Explanation of Non-GAAP Financial Measures" for detailed descriptions and information for each reconciling item
(1) Non-GAAP operating income and operating expenses include the effects of the changes in the Company's Executive Deferred Savings Plan Program ("EDSP) and the changes in the EDSP liability and asset are recorded in selling, general and administrative
expense in operating expenses. The expenses (benefits) associated with changes in the liability included in selling, general and administrative expense for the calendar years ended December 31, 2021, 2020, 2019, 2018, 2017, 2016, 2015, 2014, 2013, 2012
and 2011 were $32.2 million, $34.7 million, $39.8 million, $(6.3) million, $27.8 million, $9.5 million, $2.8 million, $12.3 million, $23.8 million, $13.6 million and $(1.8) million, respectively. The gains (losses) associated with changes in the EDSP assets
included in selling, general and administrative expense for the calendar years ended December 31, 2021, 2020, 2019, 2018, 2017, 2016, 2015, 2014, 2013, 2012 and 2011 were $32.0 million, $35.2 million, $40.8 million, $(6.5) million, $27.9 million, $9.9
million, $2.9 million, $12.8 million, $23.6 million, $14.1 million and $(0.4) million, respectively.
KLAH Investor Day 139View entire presentation