KLA Investor Day Presentation Deck
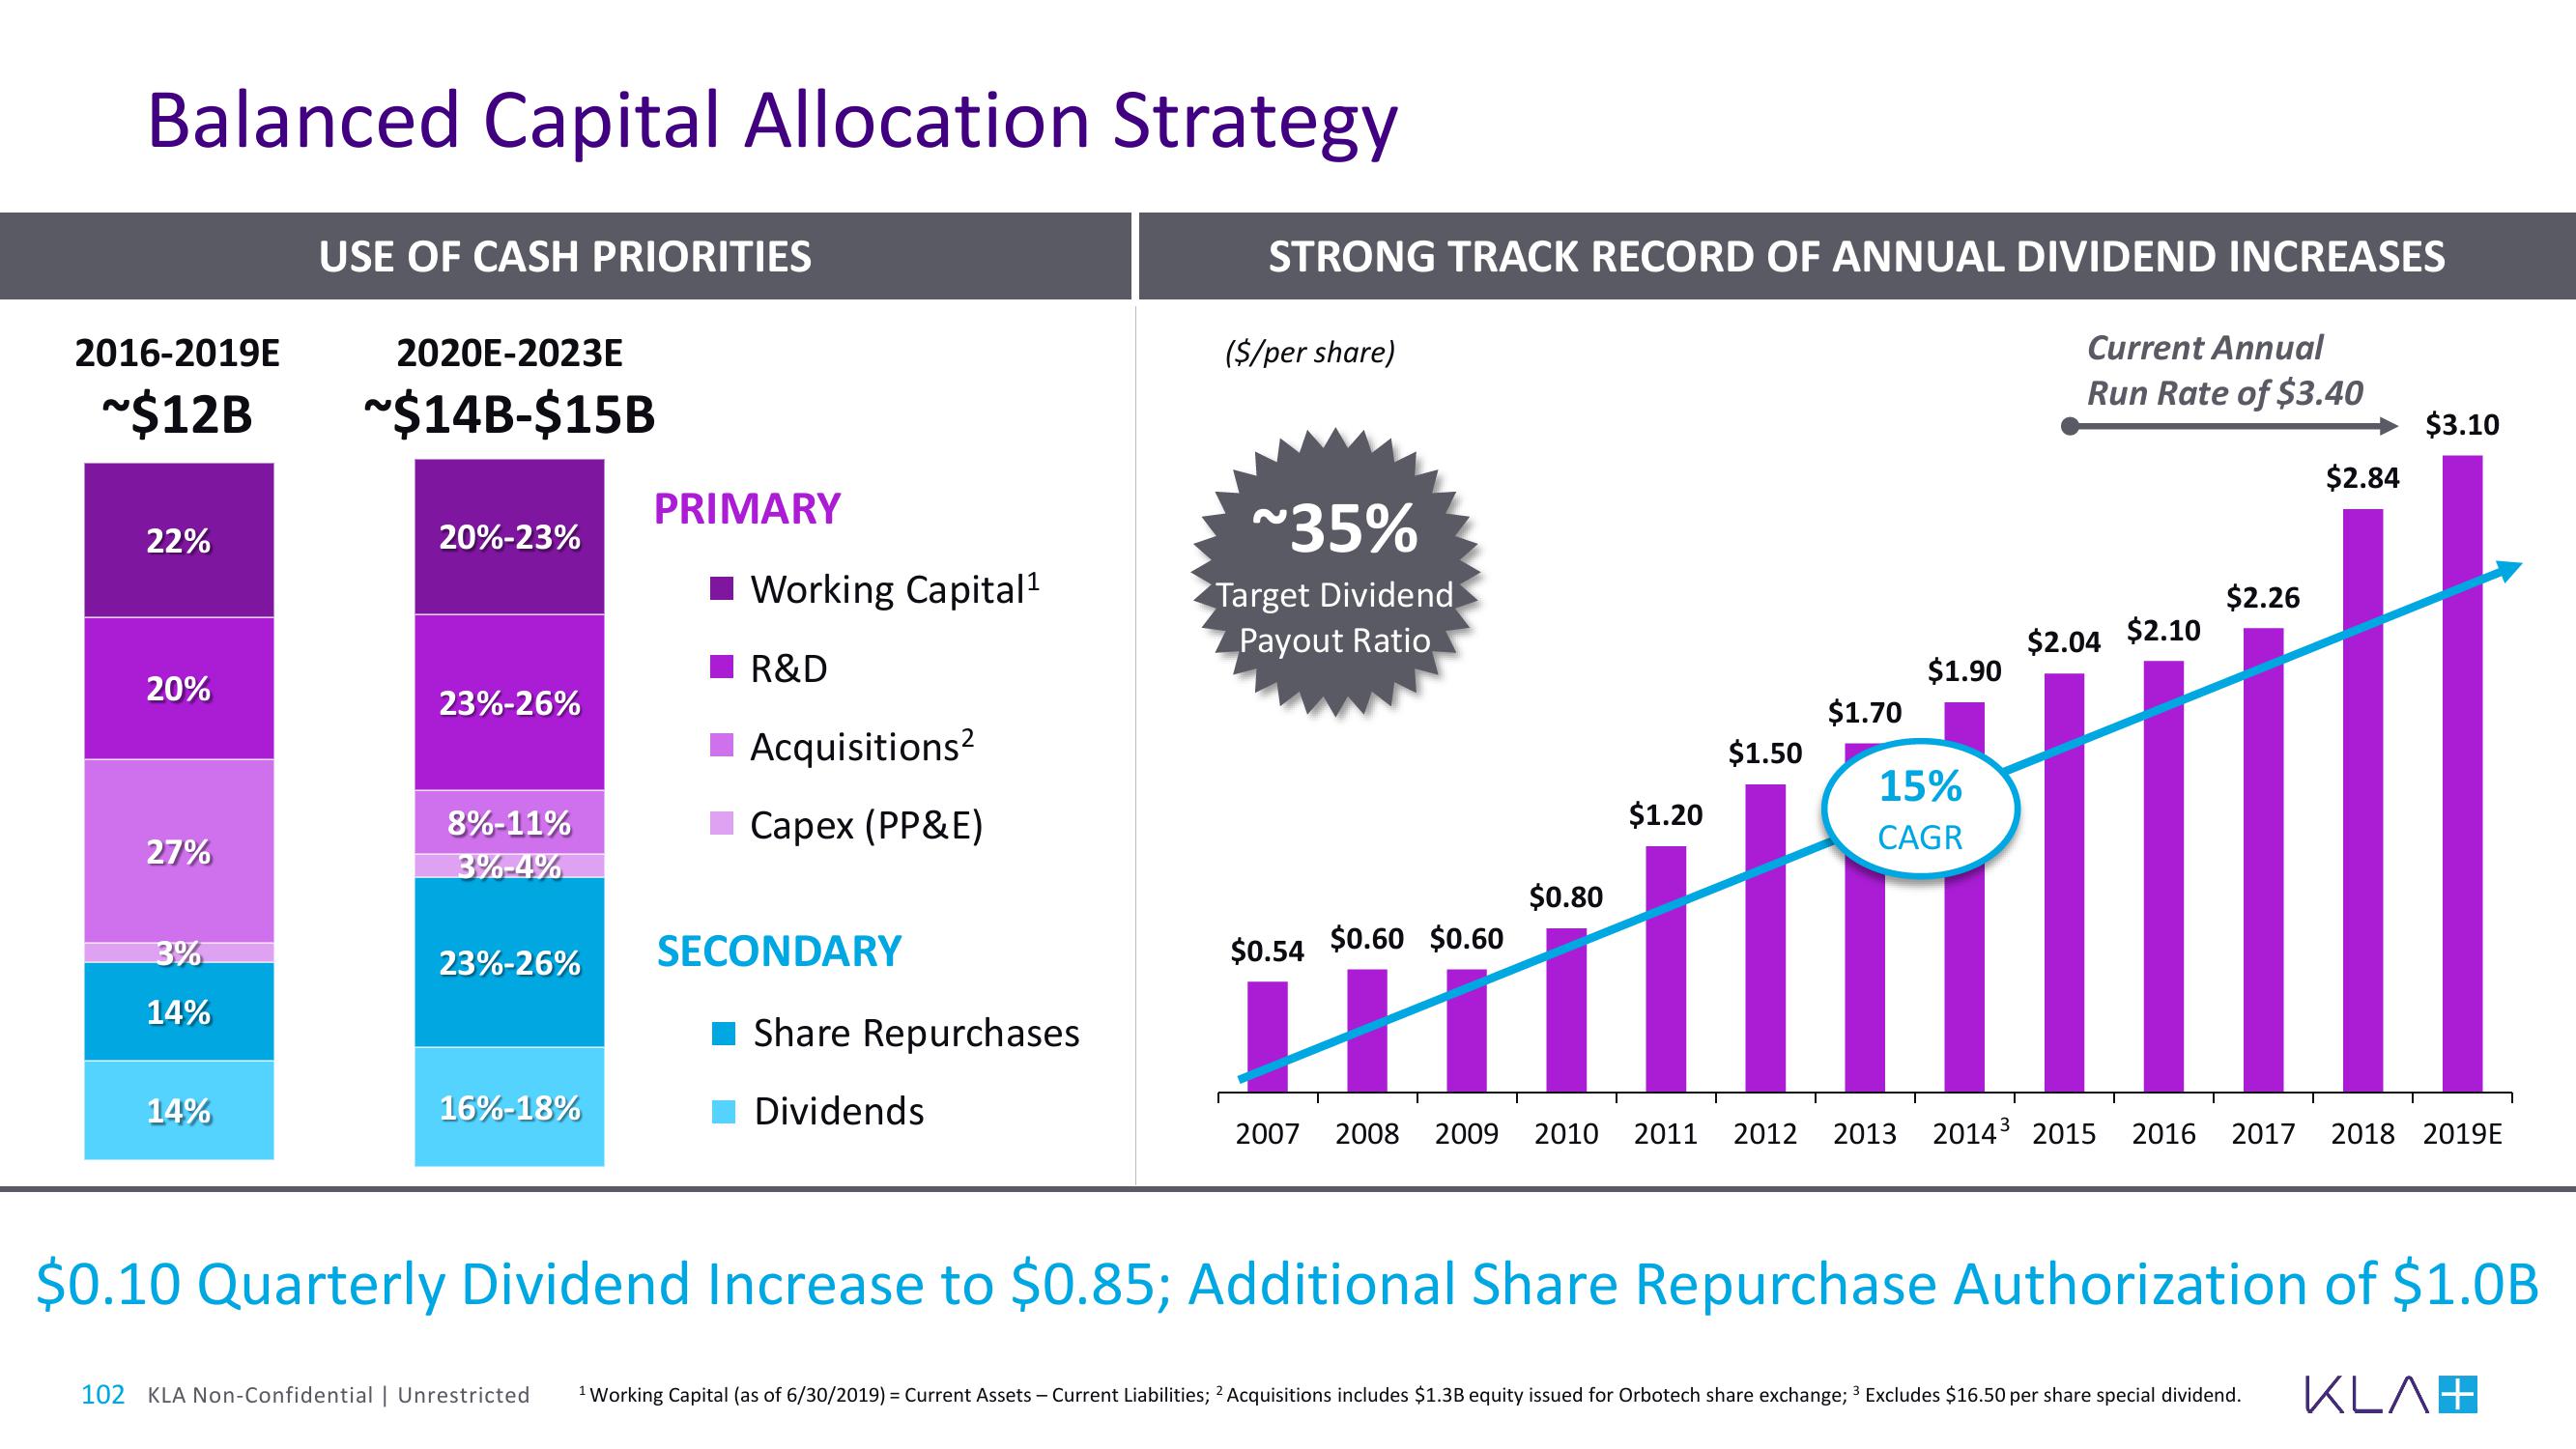
Balanced Capital Allocation Strategy
2016-2019E
2020E-2023E
~$12B ~$14B-$15B
22%
20%
27%
3%
14%
USE OF CASH PRIORITIES
14%
20%-23%
23%-26%
8%-11%
3%-4%
23%-26%
16%-18%
PRIMARY
Working Capital ¹
R&D
■ Acquisitions²
■Capex (PP&E)
SECONDARY
■Share Repurchases
Dividends
STRONG TRACK RECORD OF ANNUAL DIVIDEND INCREASES
($/per share)
~35%
Target Dividend
Payout Ratio
$0.80
$1.70
$1.50
H
$1.20
$1.90
15%
CAGR
Current Annual
Run Rate of $3.40
$2.04 $2.10
$2.26
$0.54 $0.60 $0.60
H
2007 2008 2009 2010 2011 2012 2013 2014³ 2015 2016 2017
$2.84
102 KLA Non-Confidential | Unrestricted ¹ Working Capital (as of 6/30/2019) = Current Assets - Current Liabilities; 2 Acquisitions includes $1.3B equity issued for Orbotech share exchange; ³ Excludes $16.50 per share special dividend.
3
$3.10
2018 2019E
$0.10 Quarterly Dividend Increase to $0.85; Additional Share Repurchase Authorization of $1.0B
KLA+View entire presentation