KLA Investor Day Presentation Deck
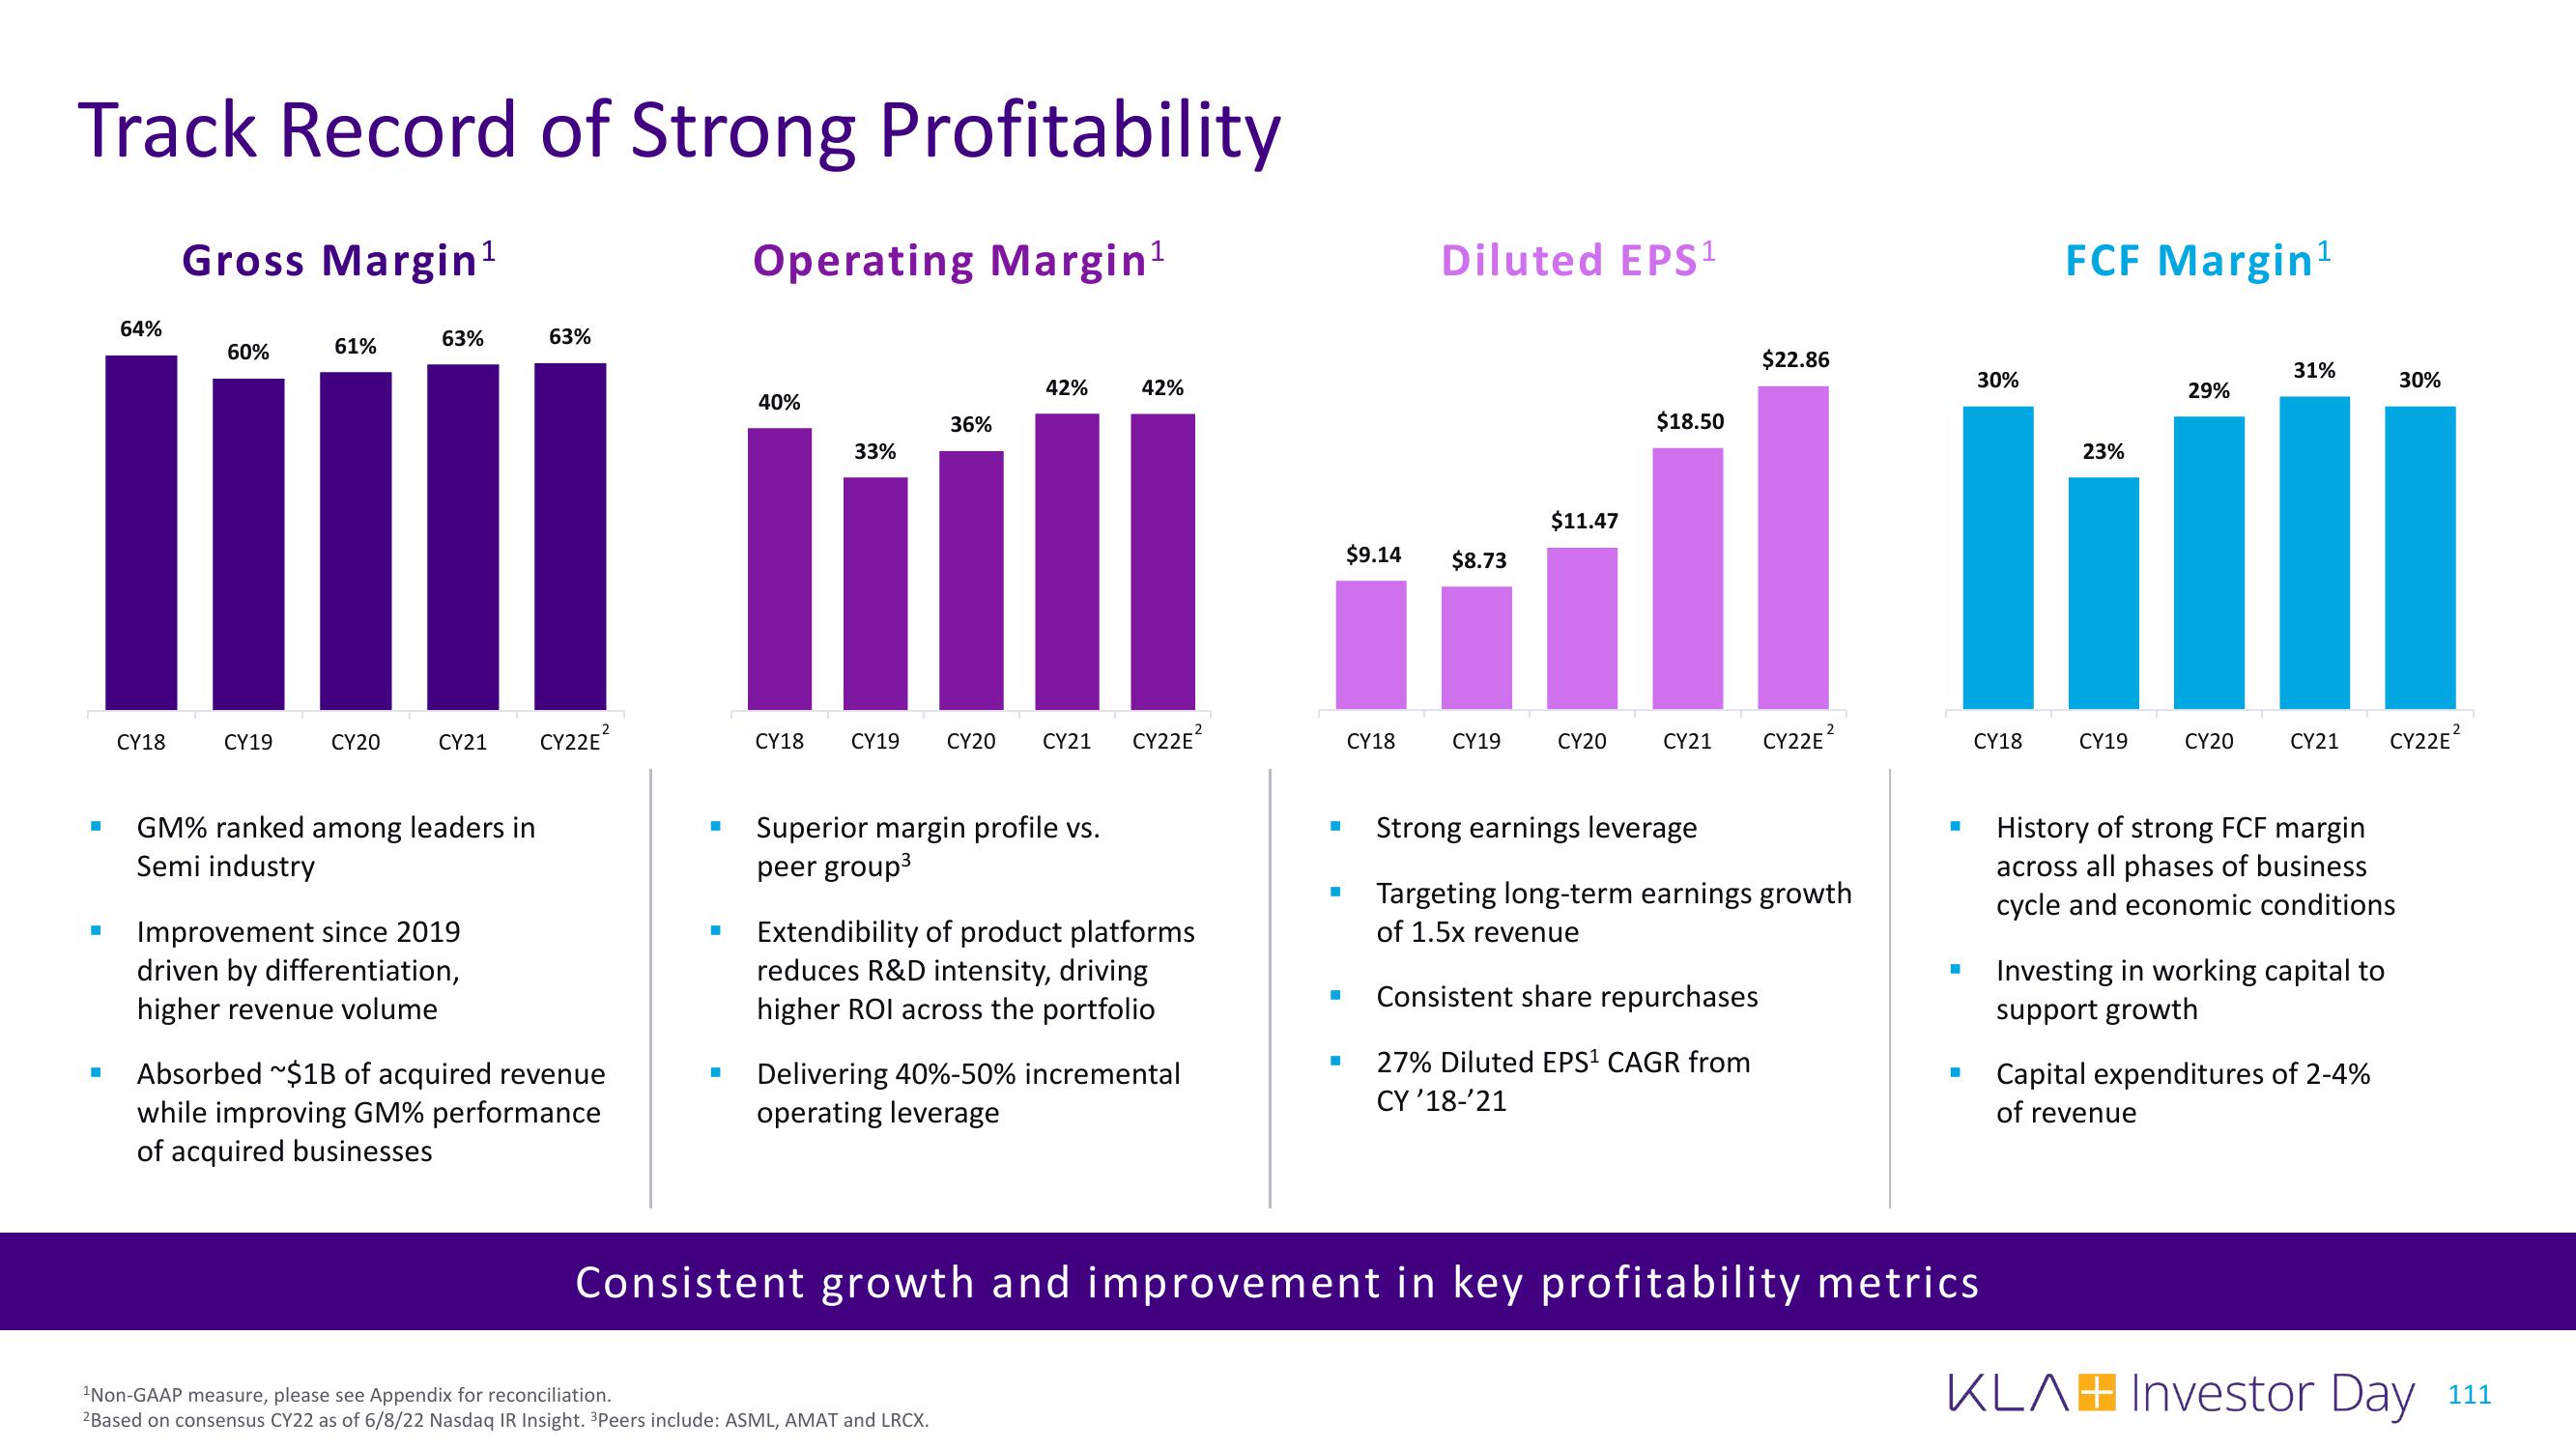
Track Record of Strong Profitability
Gross Margin¹
Operating Margin¹
64%
60%
m
■
■
■
CY18
CY19
61%
CY20
63%
CY21
GM% ranked among leaders in
Semi industry
Improvement since 2019
driven by differentiation,
higher revenue volume
63%
CY22E²
Absorbed ~$1B of acquired revenue
while improving GM% performance
of acquired businesses
I
40%
33%
36%
42%
CY18 CY19 CY20 CY21
Superior margin profile vs.
peer group³
42%
¹Non-GAAP measure, please see Appendix for reconciliation.
2Based on consensus CY22 as of 6/8/22 Nasdaq IR Insight. ³Peers include: ASML, AMAT and LRCX.
CY22E²
Extendibility of product platforms
reduces R&D intensity, driving
higher ROI across the portfolio
Delivering 40%-50% incremental
operating leverage
H
■
M
$9.14
CY18
Diluted EPS¹
$8.73
CY19
$11.47
CY20
$18.50
$22.86
CY21 CY22E²
Strong earnings leverage
Targeting long-term earnings growth
of 1.5x revenue
Consistent share repurchases
■ 27% Diluted EPS¹ CAGR from
CY '18-'21
■
I
30%
CY18
Consistent growth and improvement in key profitability metrics
FCF Margin¹
23%
CY19
29%
CY20
31%
CY21 CY22E²
History of strong FCF margin
across all phases of business
cycle and economic conditions
Investing in working capital to
support growth
30%
Capital expenditures of 2-4%
of revenue
KLAH Investor Day
111View entire presentation