Paysafe Results Presentation Deck
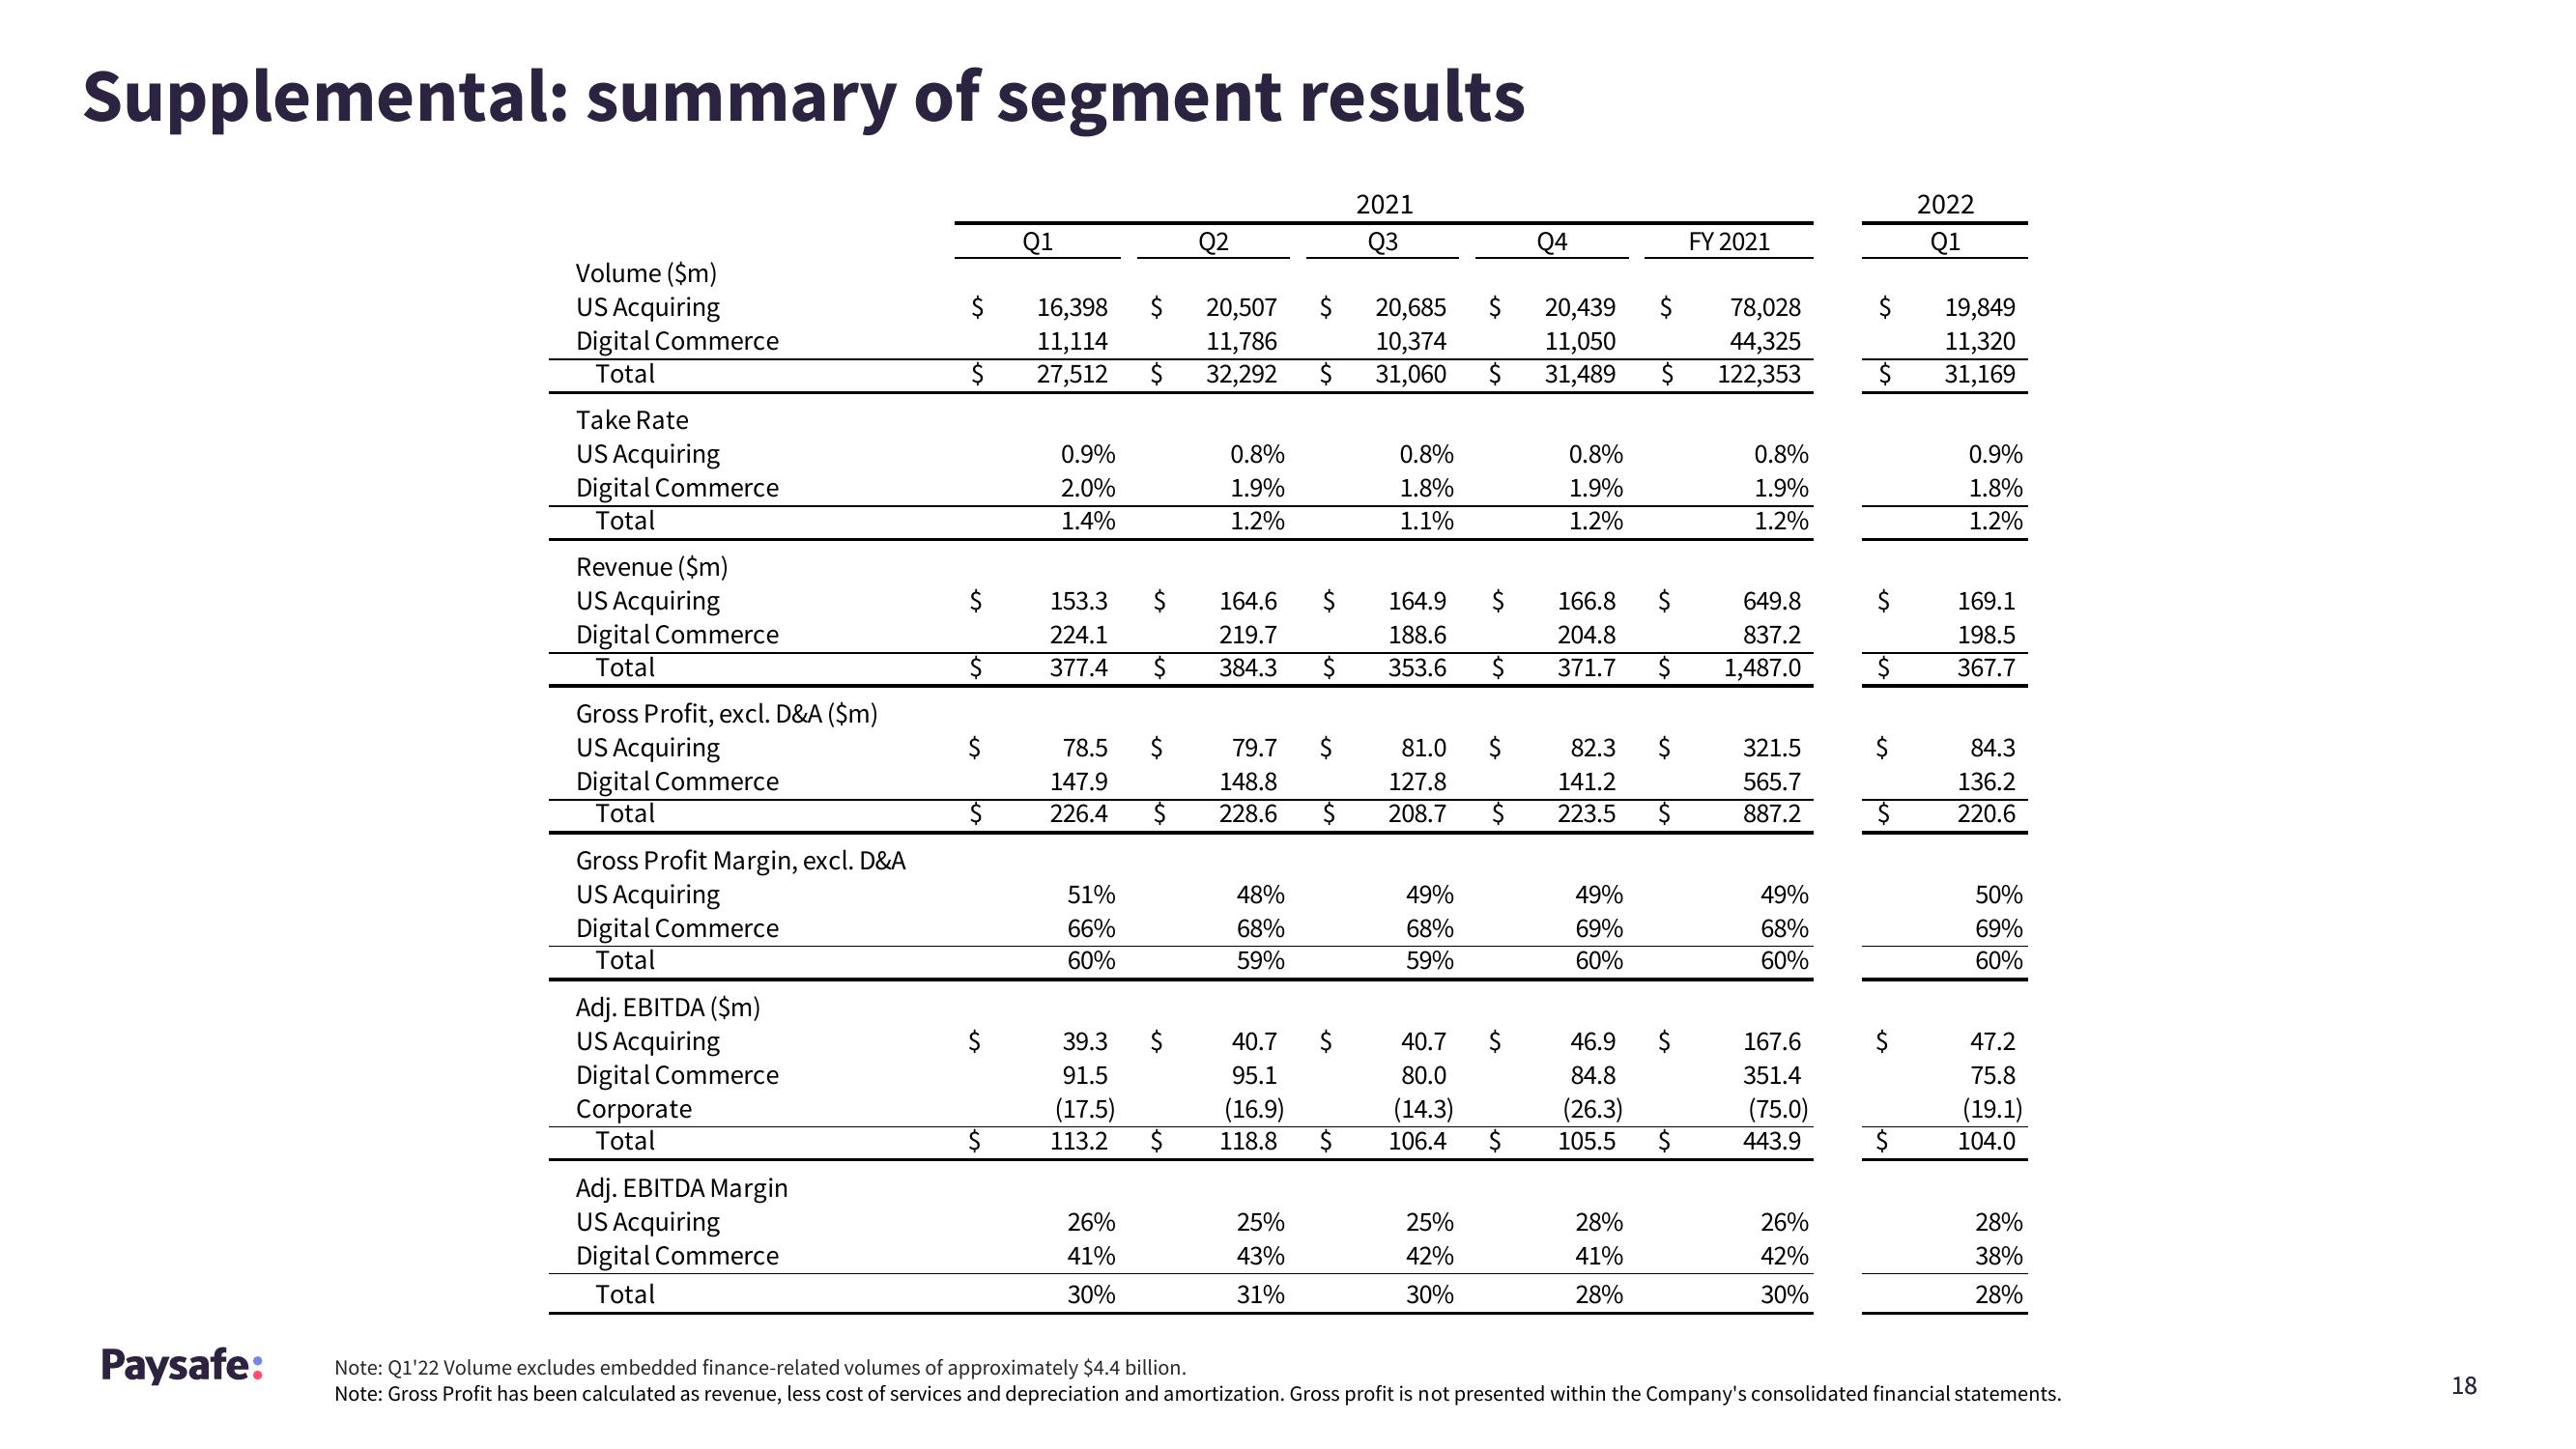
Supplemental: summary of segment results
Paysafe:
Volume ($m)
US Acquiring
Digital Commerce
Total
Take Rate
US Acquiring
Digital Commerce
Total
Revenue ($m)
US Acquiring
Digital Commerce
Total
Gross Profit, excl. D&A ($m)
US Acquiring
Digital Commerce
Total
Gross Profit Margin, excl. D&A
US Acquiring
Digital Commerce
Total
Adj. EBITDA ($m)
US Acquiring
Digital Commerce
Corporate
Total
Adj. EBITDA Margin
US Acquiring
Digital Commerce
Total
$
$
$
$
$
$
$
$
Q1
16,398 $ 20,507 $
11,114
11,786
27,512 $ 32,292 $
0.9%
2.0%
1.4%
153.3
224.1
377.4 $
78.5 $
147.9
226.4
$
51%
66%
60%
26%
41%
30%
Q2
0.8%
1.9%
1.2%
$
164.6 $
219.7
384.3
48%
68%
59%
$
25%
43%
31%
2021
૨૩
$
20,685 $ 20,439
10,374
11,050
31,060 $ 31,489
0.8%
1.8%
1.1%
40.7
39.3
91.5
(17.5)
40.7
95.1
(16.9)
80.0
(14.3)
113.2 $ 118.8 $ 106.4 $
164.9
188.6
353.6 $
79.7 $
148.8
81.0 $
127.8
82.3 $
141.2
$ 228.6 $ 208.7 $ 223.5 $
$
49%
68%
59%
25%
42%
30%
Q4
$
0.8%
1.9%
1.2%
166.8 $
204.8
371.7 $
49%
69%
60%
46.9
84.8
(26.3)
105.5
$
78,028
44,325
$ 122,353
28%
41%
28%
$
FY 2021
$
0.8%
1.9%
1.2%
649.8
837.2
1,487.0
321.5
565.7
887.2
49%
68%
60%
167.6
351.4
(75.0)
443.9
26%
42%
30%
$
$
$
$
$
$
$
$
2022
Q1
19,849
11,320
31,169
0.9%
1.8%
1.2%
169.1
198.5
367.7
84.3
136.2
220.6
50%
69%
60%
47.2
75.8
(19.1)
104.0
28%
38%
28%
Note: Q1'22 Volume excludes embedded finance-related volumes of approximately $4.4 billion.
Note: Gross Profit has been calculated as revenue, less cost of services and depreciation and amortization. Gross profit is not presented within the Company's consolidated financial statements.
18View entire presentation