Apollo Global Management Investor Day Presentation Deck slide image

Apollo Global Management Investor Day Presentation Deck

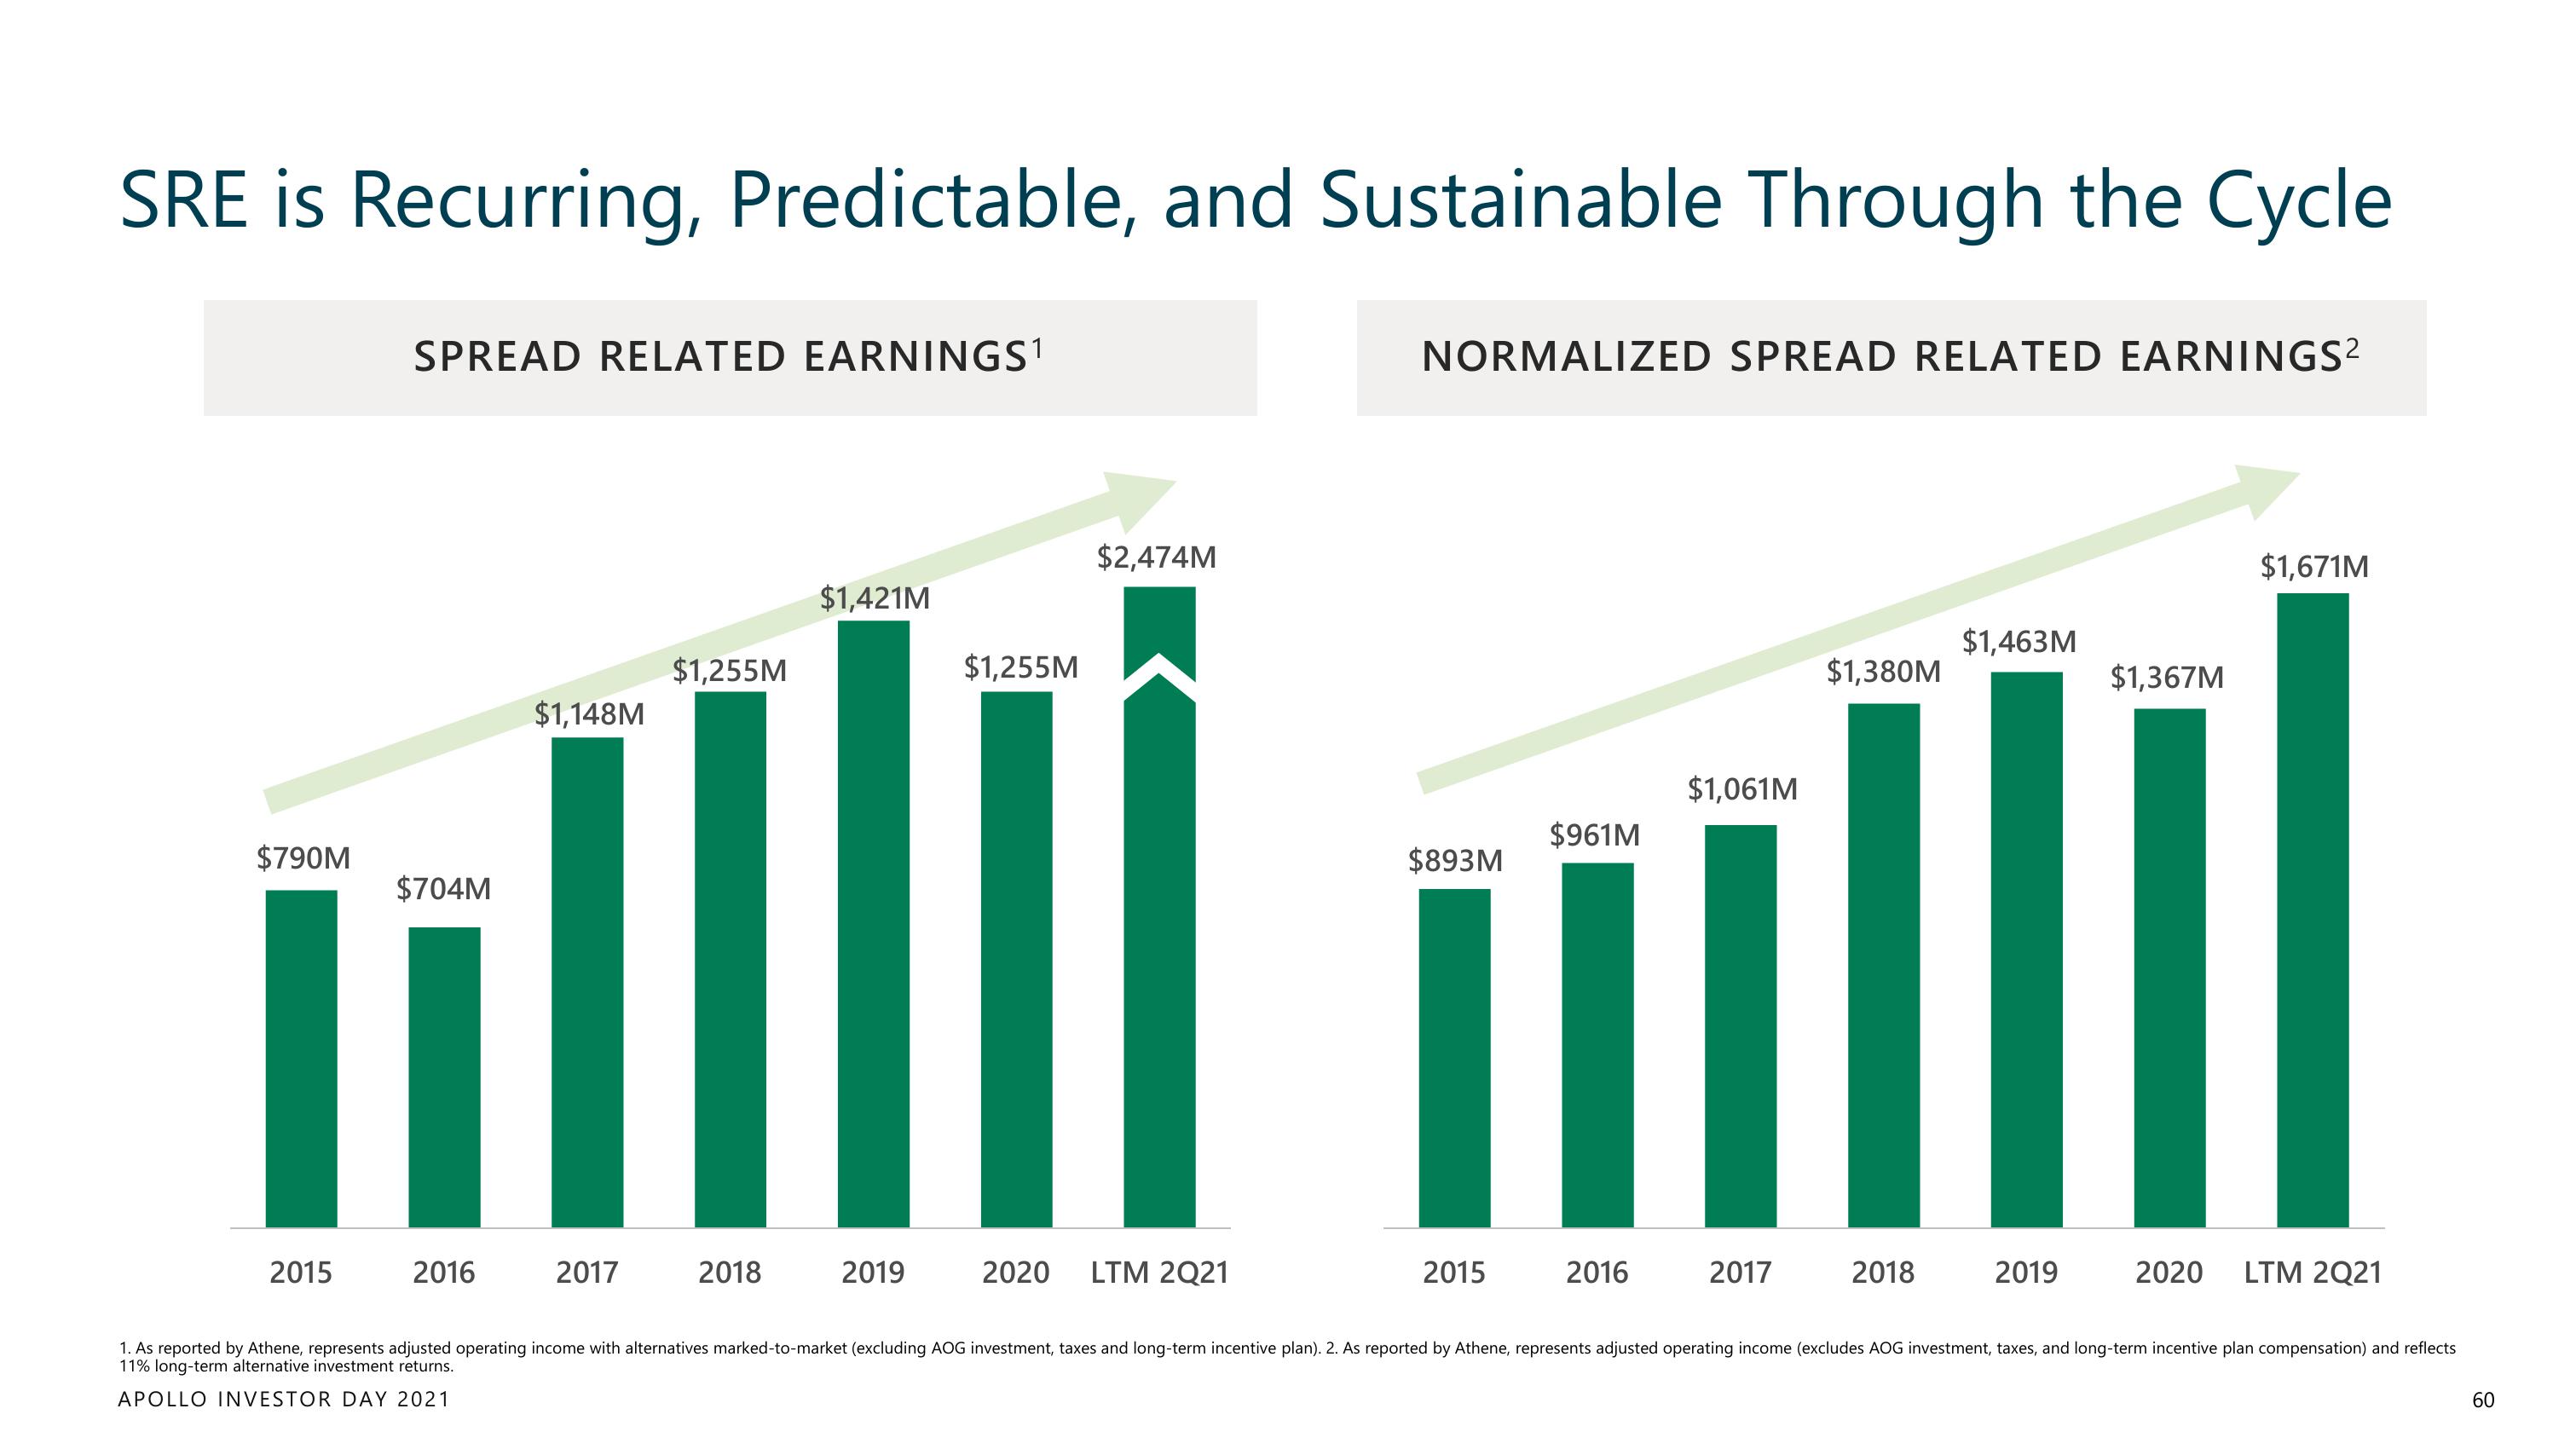
SRE is Recurring, Predictable, and Sustainable Through the Cycle $790M 2015 SPREAD RELATED EARNINGS¹ $704M 2016 $1,148M 2017 $1,255M 2018 $1,421M 2019 $1,255M $2,474M 2020 LTM 2Q21 NORMALIZED SPREAD RELATED EARNINGS² $893M 2015 $961M 2016 $1,061M 2017 $1,380M 2018 $1,463M 2019 $1,367M $1,671M 2020 LTM 2Q21 1. As reported by Athene, represents adjusted operating income with alternatives marked-to-market (excluding AOG investment, taxes and long-term incentive plan). 2. As reported by Athene, represents adjusted operating income (excludes AOG investment, taxes, and long-term incentive plan compensation) and reflects 11% long-term alternative investment returns. APOLLO INVESTOR DAY 2021 60
View entire presentation