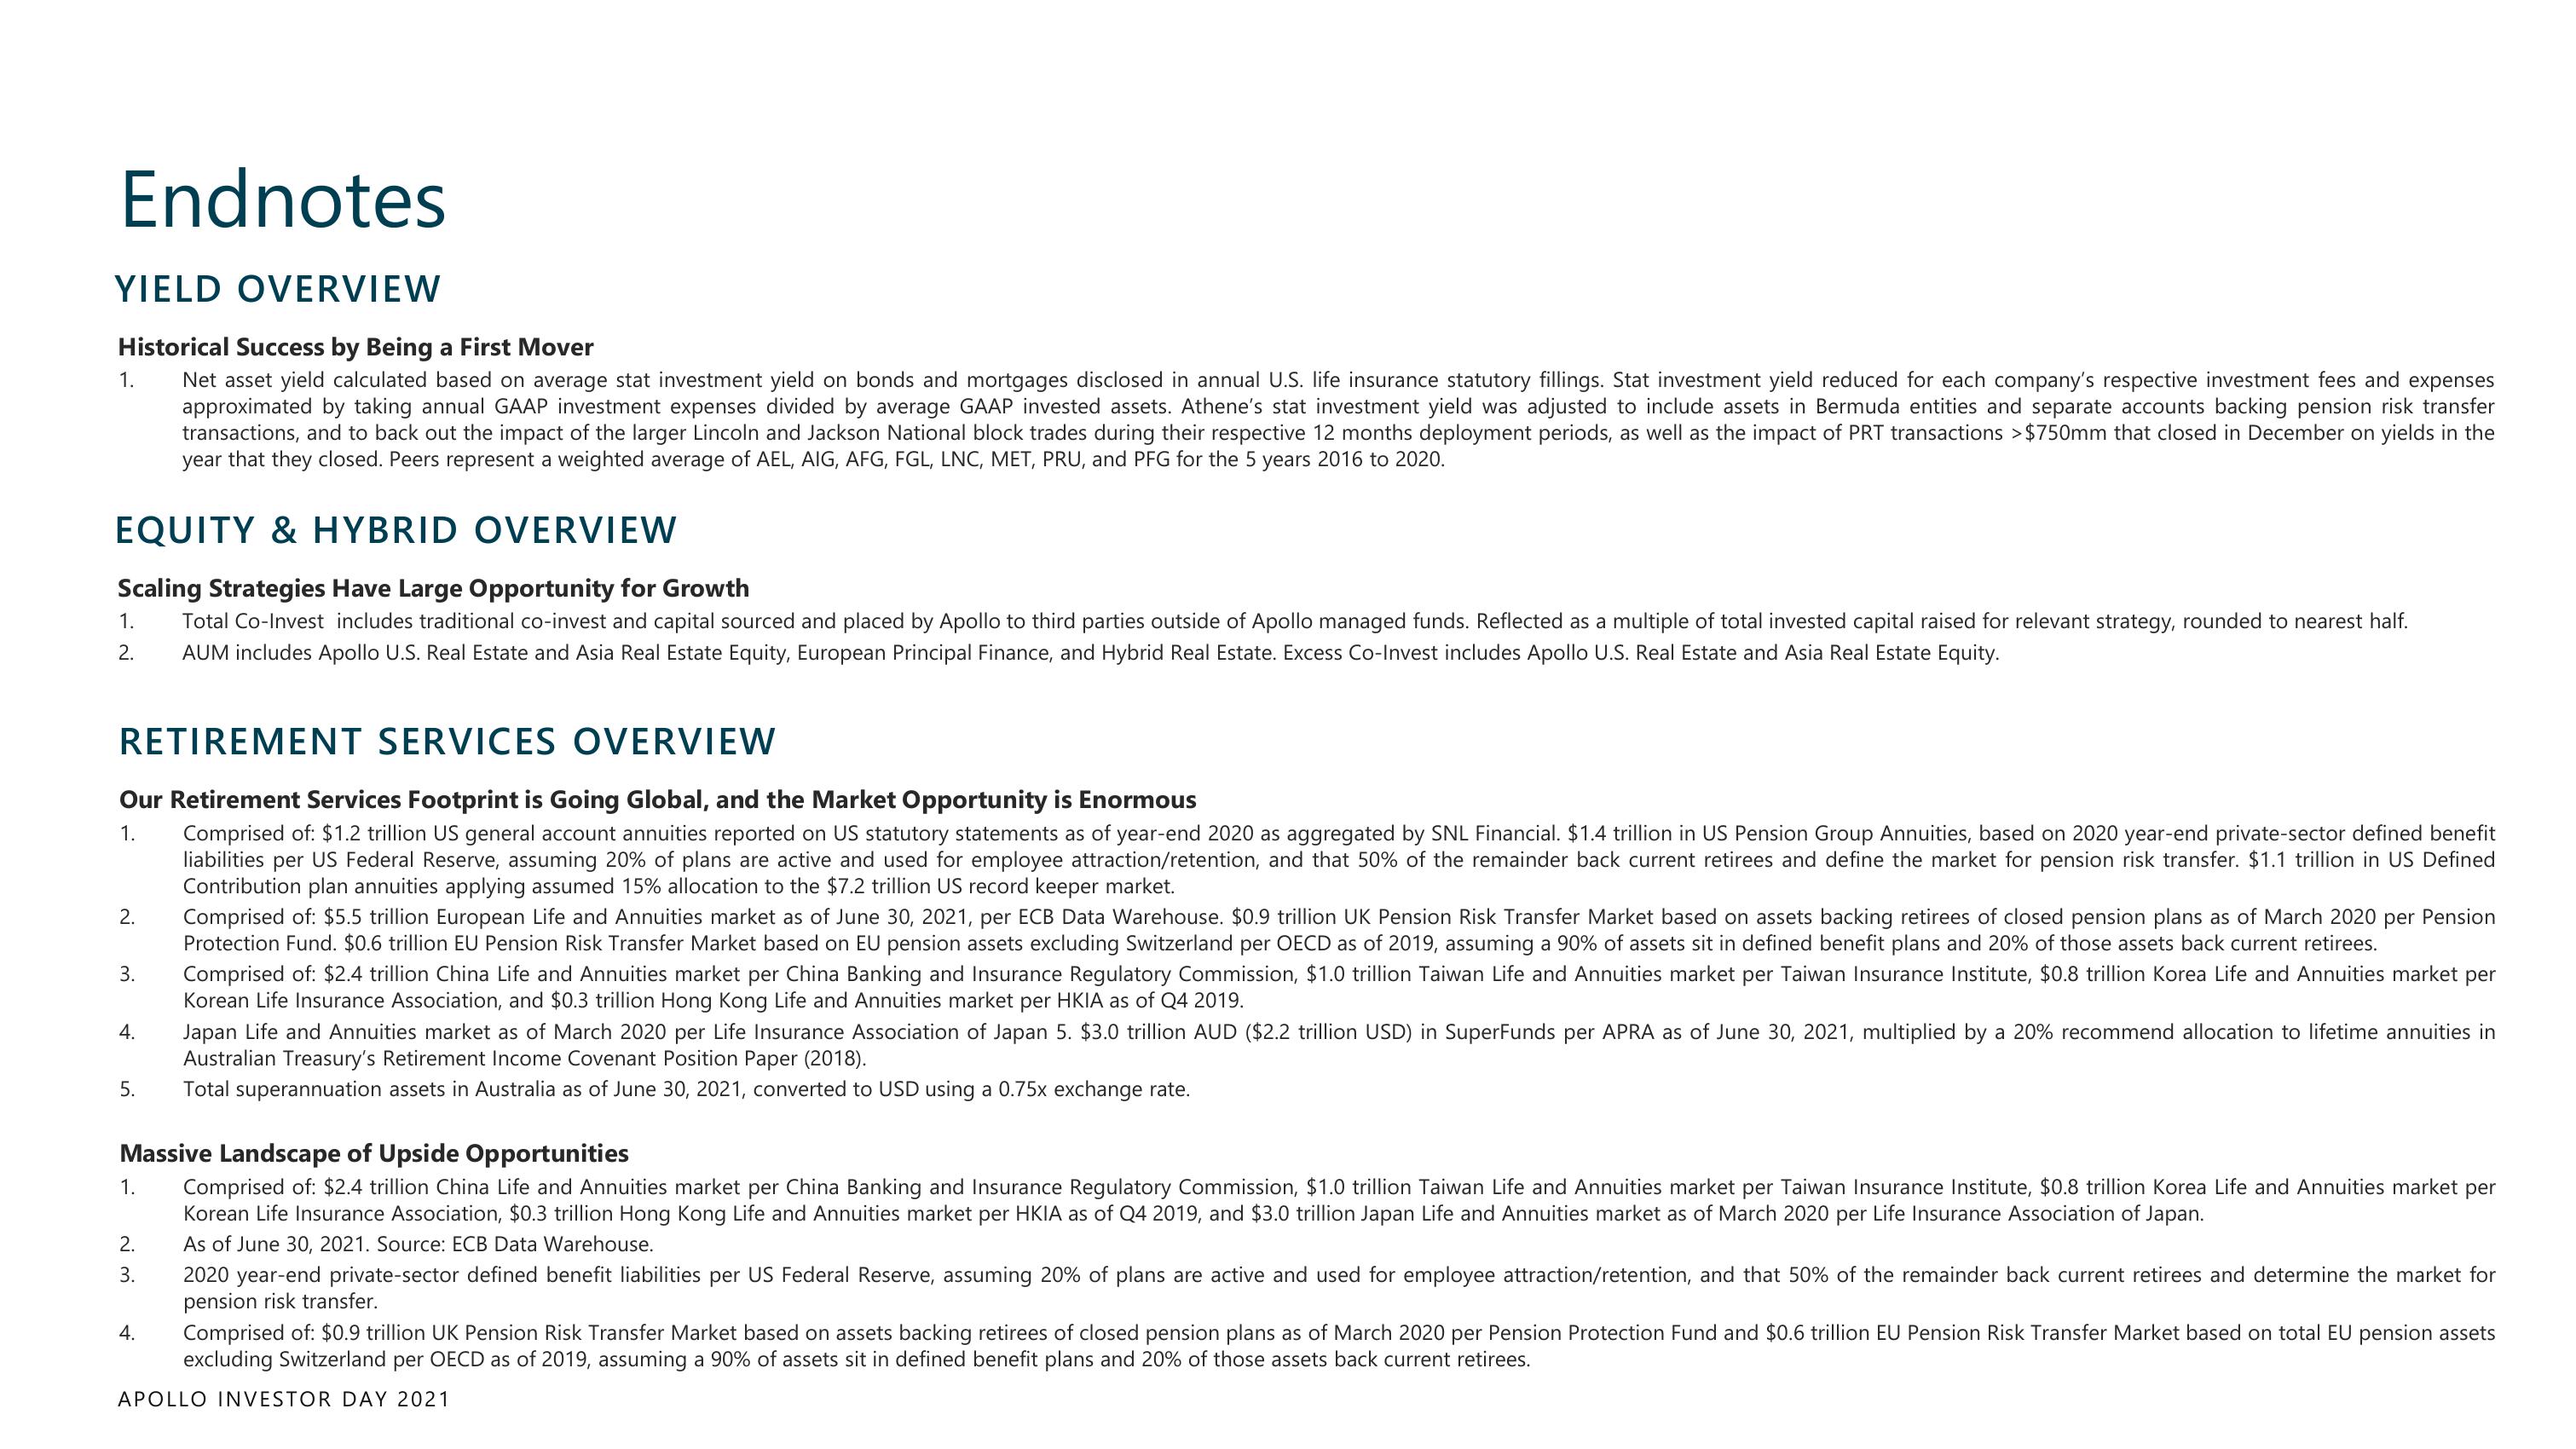
Apollo Global Management Investor Day Presentation Deck
Endnotes
YIELD OVERVIEW
Historical Success by Being a First Mover
Net asset yield calculated based on average stat investment yield on bonds and mortgages disclosed in annual U.S. life insurance statutory fillings. Stat investment yield reduced for each company's respective investment fees and expenses
approximated by taking annual GAAP investment expenses divided by average GAAP invested assets. Athene's stat investment yield was adjusted to include assets in Bermuda entities and separate accounts backing pension risk transfer
transactions, and to back out the impact of the larger Lincoln and Jackson National block trades during their respective 12 months deployment periods, as well as the impact of PRT transactions >$750mm that closed in December on yields in the
year that they closed. Peers represent a weighted average of AEL, AIG, AFG, FGL, LNC, MET, PRU, and PFG for the 5 years 2016 to 2020.
1.
EQUITY & HYBRID OVERVIEW
Scaling Strategies Have Large Opportunity for Growth
1. Total Co-Invest includes traditional co-invest and capital sourced and placed by Apollo to third parties outside of Apollo managed funds. Reflected as a multiple of total invested capital raised for relevant strategy, rounded to nearest half.
AUM includes Apollo U.S. Real Estate and Asia Real Estate Equity, European Principal Finance, and Hybrid Real Estate. Excess Co-Invest includes Apollo U.S. Real Estate and Asia Real Estate Equity.
2.
RETIREMENT SERVICES OVERVIEW
Our Retirement Services Footprint is Going Global, and the Market Opportunity is Enormous
1.
Comprised of: $1.2 trillion US general account annuities reported on US statutory statements as of year-end 2020 as aggregated by SNL Financial. $1.4 trillion in US Pension Group Annuities, based on 2020 year-end private-sector defined benefit
liabilities per US Federal Reserve, assuming 20% of plans are active and used for employee attraction/retention, and that 50% of the remainder back current retirees and define the market for pension risk transfer. $1.1 trillion in US Defined
Contribution plan annuities applying assumed 15% allocation to the $7.2 trillion US record keeper market.
2.
3.
4.
5.
1.
2.
3.
Comprised of: $5.5 trillion European Life and Annuities market as of June 30, 2021, per ECB Data Warehouse. $0.9 trillion UK Pension Risk Transfer Market based on assets backing retirees of closed pension plans as of March 2020 per Pension
Protection Fund. $0.6 trillion EU Pension Risk Transfer Market based on EU pension assets excluding Switzerland per OECD as of 2019, assuming a 90% of assets sit in defined benefit plans and 20% of those assets back current retirees.
Massive Landscape of Upside Opportunities
Comprised of: $2.4 trillion China Life and Annuities market per China Banking and Insurance Regulatory Commission, $1.0 trillion Taiwan Life and Annuities market per Taiwan Insurance Institute, $0.8 trillion Korea Life and Annuities market per
Korean Life Insurance Association, $0.3 trillion Hong Kong Life and Annuities market per HKIA as of Q4 2019, and $3.0 trillion Japan Life and Annuities market as of March 2020 per Life Insurance Association of Japan.
As of June 30, 2021. Source: ECB Data Warehouse.
Comprised of: $2.4 trillion China Life and Annuities market per China Banking and Insurance Regulatory Commission, $1.0 trillion Taiwan Life and Annuities market per Taiwan Insurance Institute, $0.8 trillion Korea Life and Annuities market per
Korean Life Insurance Association, and $0.3 trillion Hong Kong Life and Annuities market per HKIA as of Q4 2019.
4.
Japan Life and Annuities market as of March 2020 per Life Insurance Association of Japan 5. $3.0 trillion AUD ($2.2 trillion USD) in SuperFunds per APRA as of June 30, 2021, multiplied by a 20% recommend allocation to lifetime annuities in
Australian Treasury's Retirement Income Covenant Position Paper (2018).
Total superannuation assets in Australia as of June 30, 2021, converted to USD using a 0.75x exchange rate.
2020 year-end private-sector defined benefit liabilities per US Federal Reserve, assuming 20% of plans are active and used for employee attraction/retention, and that 50% of the remainder back current retirees and determine the market for
pension risk transfer.
Comprised of: $0.9 trillion UK Pension Risk Transfer Market based on assets backing retirees of closed pension plans as of March 2020 per Pension Protection Fund and $0.6 trillion EU Pension Risk Transfer Market based on total EU pension assets
excluding Switzerland per OECD as of 2019, assuming a 90% of assets sit in defined benefit plans and 20% of those assets back current retirees.
APOLLO INVESTOR DAY 2021View entire presentation