Tradeweb ESG Presentation Deck
Sustainable Finance Solutions
We continue to promote the visibility and accessibility of Green Bond trading activity across a
wide range of asset classes, as well as to provide more clarity around our own Green Bond
trading volumes.
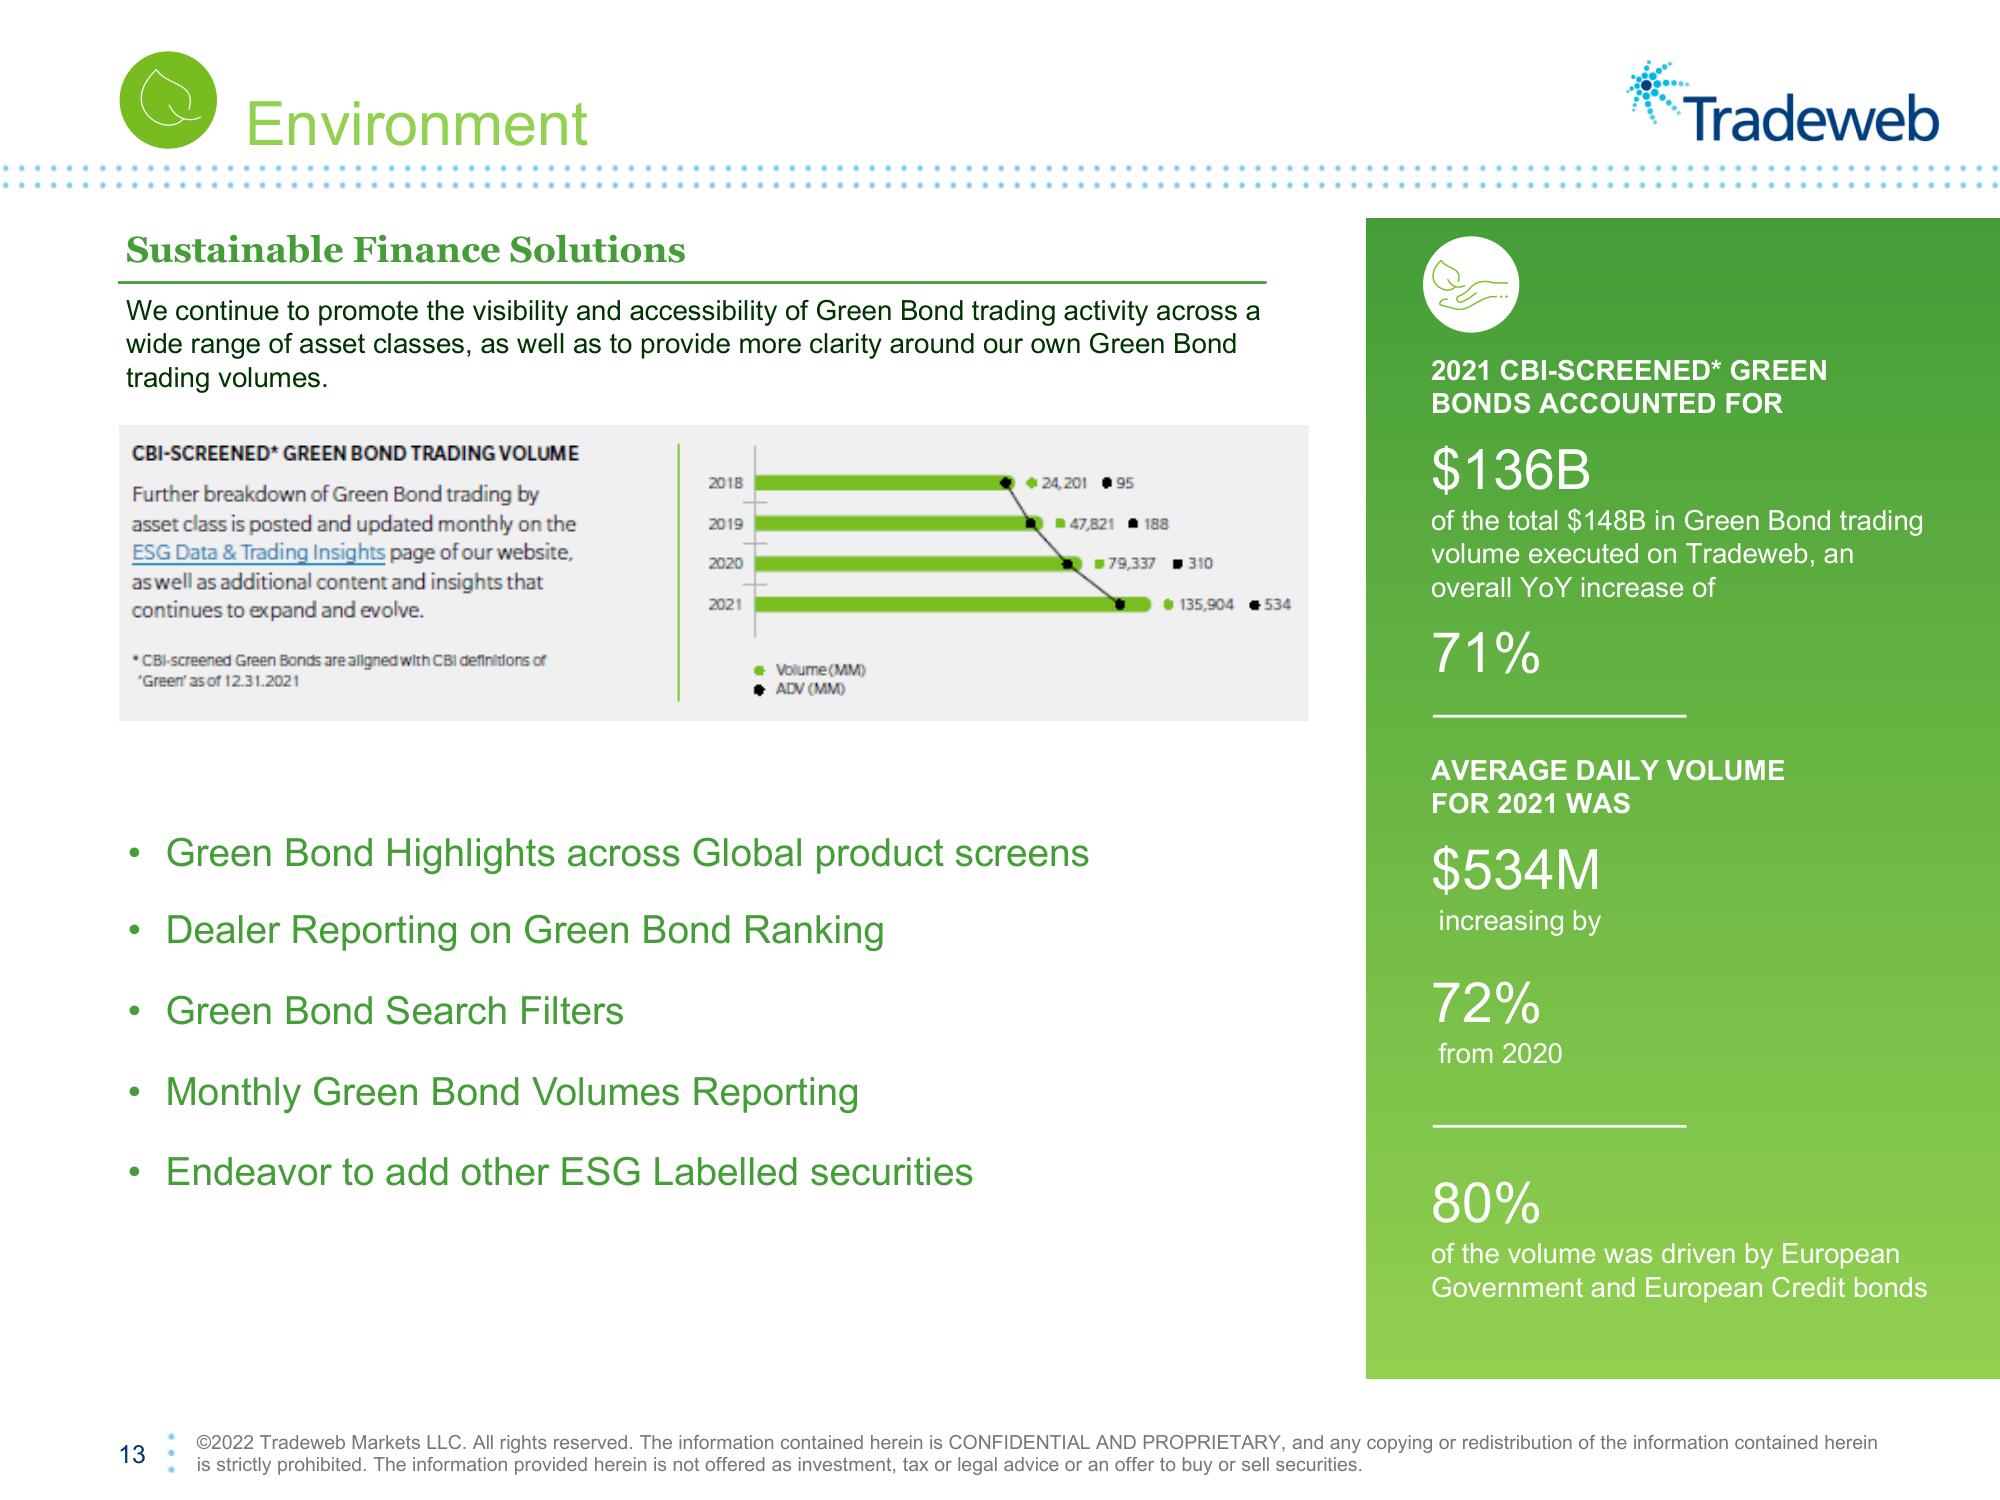
CBI-SCREENED* GREEN BOND TRADING VOLUME
Further breakdown of Green Bond trading by
asset class is posted and updated monthly on the
ESG Data & Trading Insights page of our website,
as well as additional content and insights that
continues to expand and evolve.
*CBI-screened Green Bonds are alligned with CBI definitions of
"Green' as of 12.31.2021
●
Environment
●
●
•
13
2018
2019
2020
Green Bond Highlights across Global product screens
• Dealer Reporting on Green Bond Ranking
Green Bond Search Filters
2021
* Volume (MM)
ADV (MM)
◆ 24,201 95
Monthly Green Bond Volumes Reporting
Endeavor to add other ESG Labelled securities
47,821 188
79,337
310
135,904 534
2021 CBI-SCREENED* GREEN
BONDS ACCOUNTED FOR
Tradeweb
$136B
of the total $148B in Green Bond trading
volume executed on Tradeweb, an
overall YoY increase of
71%
AVERAGE DAILY VOLUME
FOR 2021 WAS
$534M
increasing by
72%
from 2020
80%
of the volume was driven by European
Government and European Credit bonds
Ⓒ2022 Tradeweb Markets LLC. All rights reserved. The information contained herein is CONFIDENTIAL AND PROPRIETARY, and any copying or redistribution of the information contained herein
is strictly prohibited. The information provided herein is not offered as investment, tax or legal advice or an offer to buy or sell securities.View entire presentation