Bionomics Results Presentation Deck
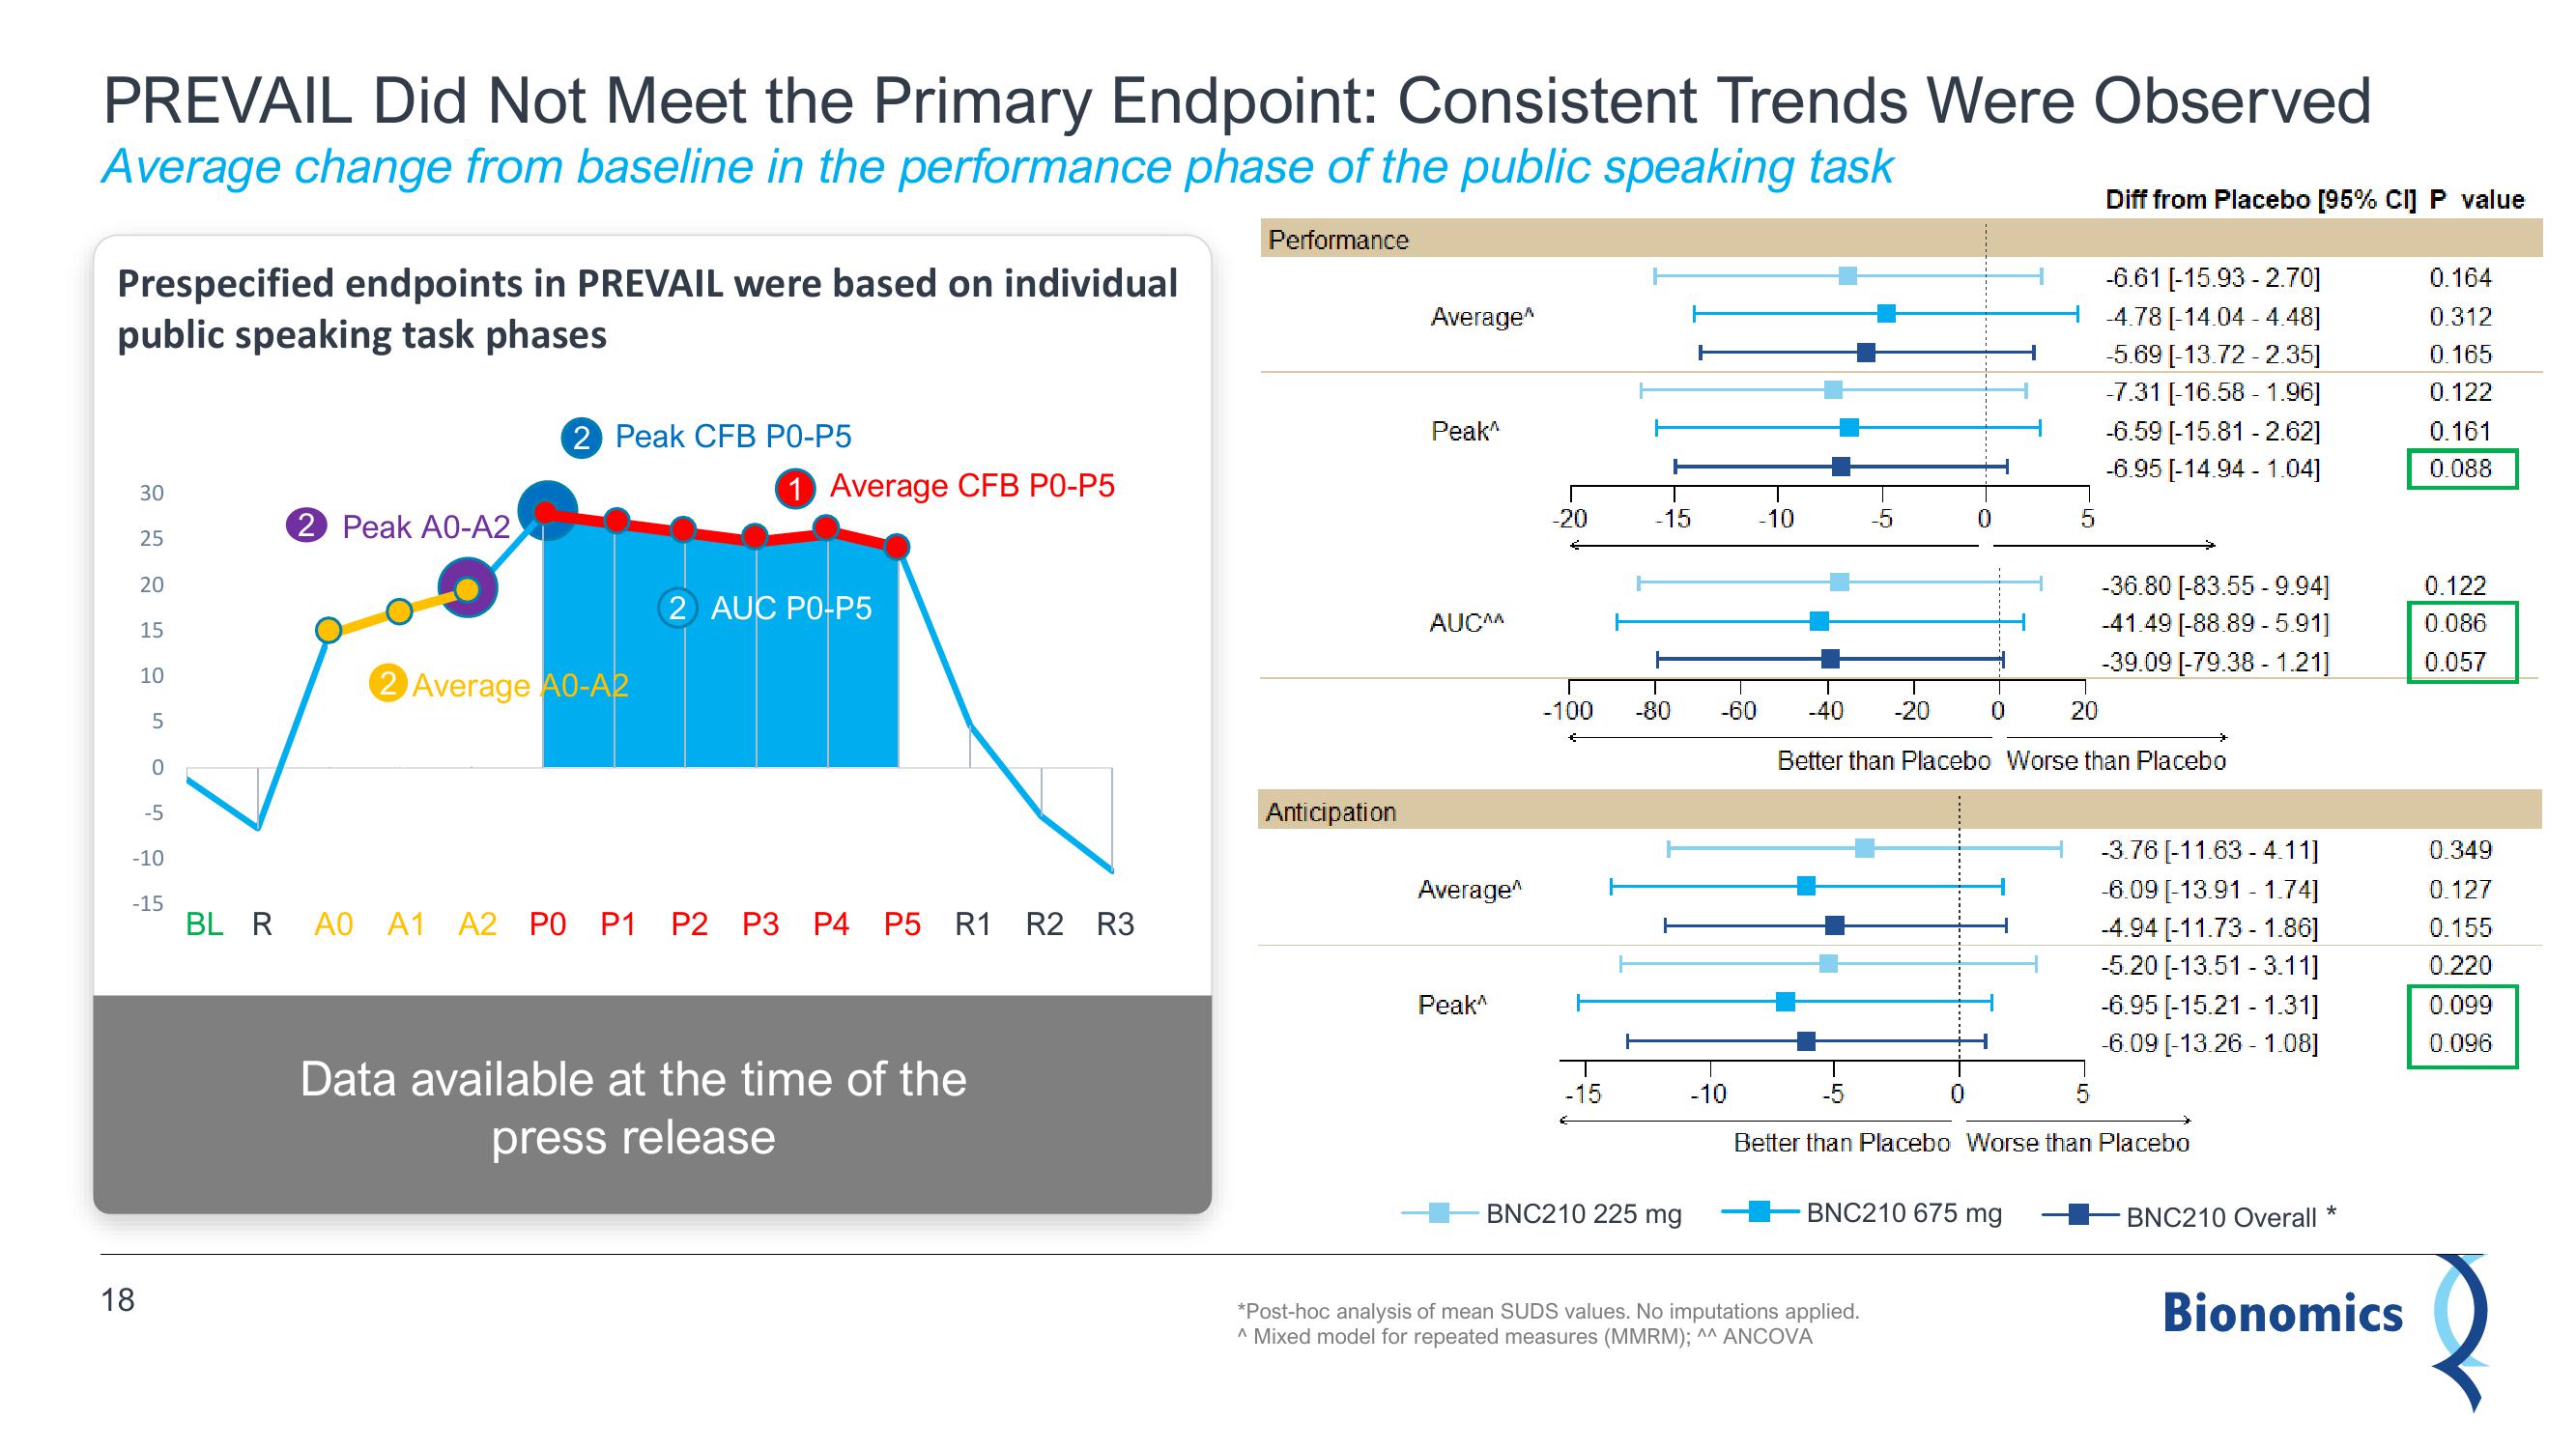
PREVAIL Did Not Meet the Primary Endpoint: Consistent Trends Were Observed
Average change from baseline in the performance phase of the public speaking task
Performance
Prespecified endpoints in PREVAIL were based on individual
public speaking task phases
30
25
18
20
15
10
5
0
-5
-10
-15
2 Peak A0-A2
2 Peak CFB PO-P5
2 Average AO-A2
1 Average CFB P0-P5
2 AUC PO-P5
BL RA0 A1 A2 PO P1 P2 P3 P4 P5 R1 R2 R3
Data available at the time of the
press release
Anticipation
Average
Peak
AUCA
Average
Peak
-20
H
-100 -80
-15
-15
H
BNC210 225 mg
-10
-10
-60 -40 -20
-5
0
0
*Post-hoc analysis of mean SUDS values. No imputations applied.
^ Mixed model for repeated measures (MMRM); ^^ ANCOVA
5
BNC210 675 mg
20
Diff from Placebo [95% CI] P value
-6.61 [-15.93-2.70]
-4.78 [-14.04-4.48]
-5.69 [-13.72-2.35]
-7.31 [-16.58 -1.96]
-6.59 [-15.81 -2.62]
-6.95 [-14.94-1.04]
Better than Placebo Worse than Placebo
-36.80 [-83.55-9.94]
-41.49 [-88.89-5.91]
-39.09 [-79.38-1.21]
5
Better than Placebo Worse than Placebo
-3.76 [-11.63-4.11]
-6.09 [-13.91 - 1.74]
-4.94 [-11.73 1.86]
-5.20 [-13.51-3.11]
-6.95 [-15.21 1.31]
-6.09 [-13.26 -1.08]
BNC210 Overall *
Bionomics
0.164
0.312
0.165
0.122
0.161
0.088
0.122
0.086
0.057
0.349
0.127
0.155
0.220
0.099
0.096View entire presentation