Central Pacific Financial Investor Presentation Deck
2
●
●
Consistent & sustainable growth
$ Millions
5,500
5,000
4,500
4,000
3,500
3,000
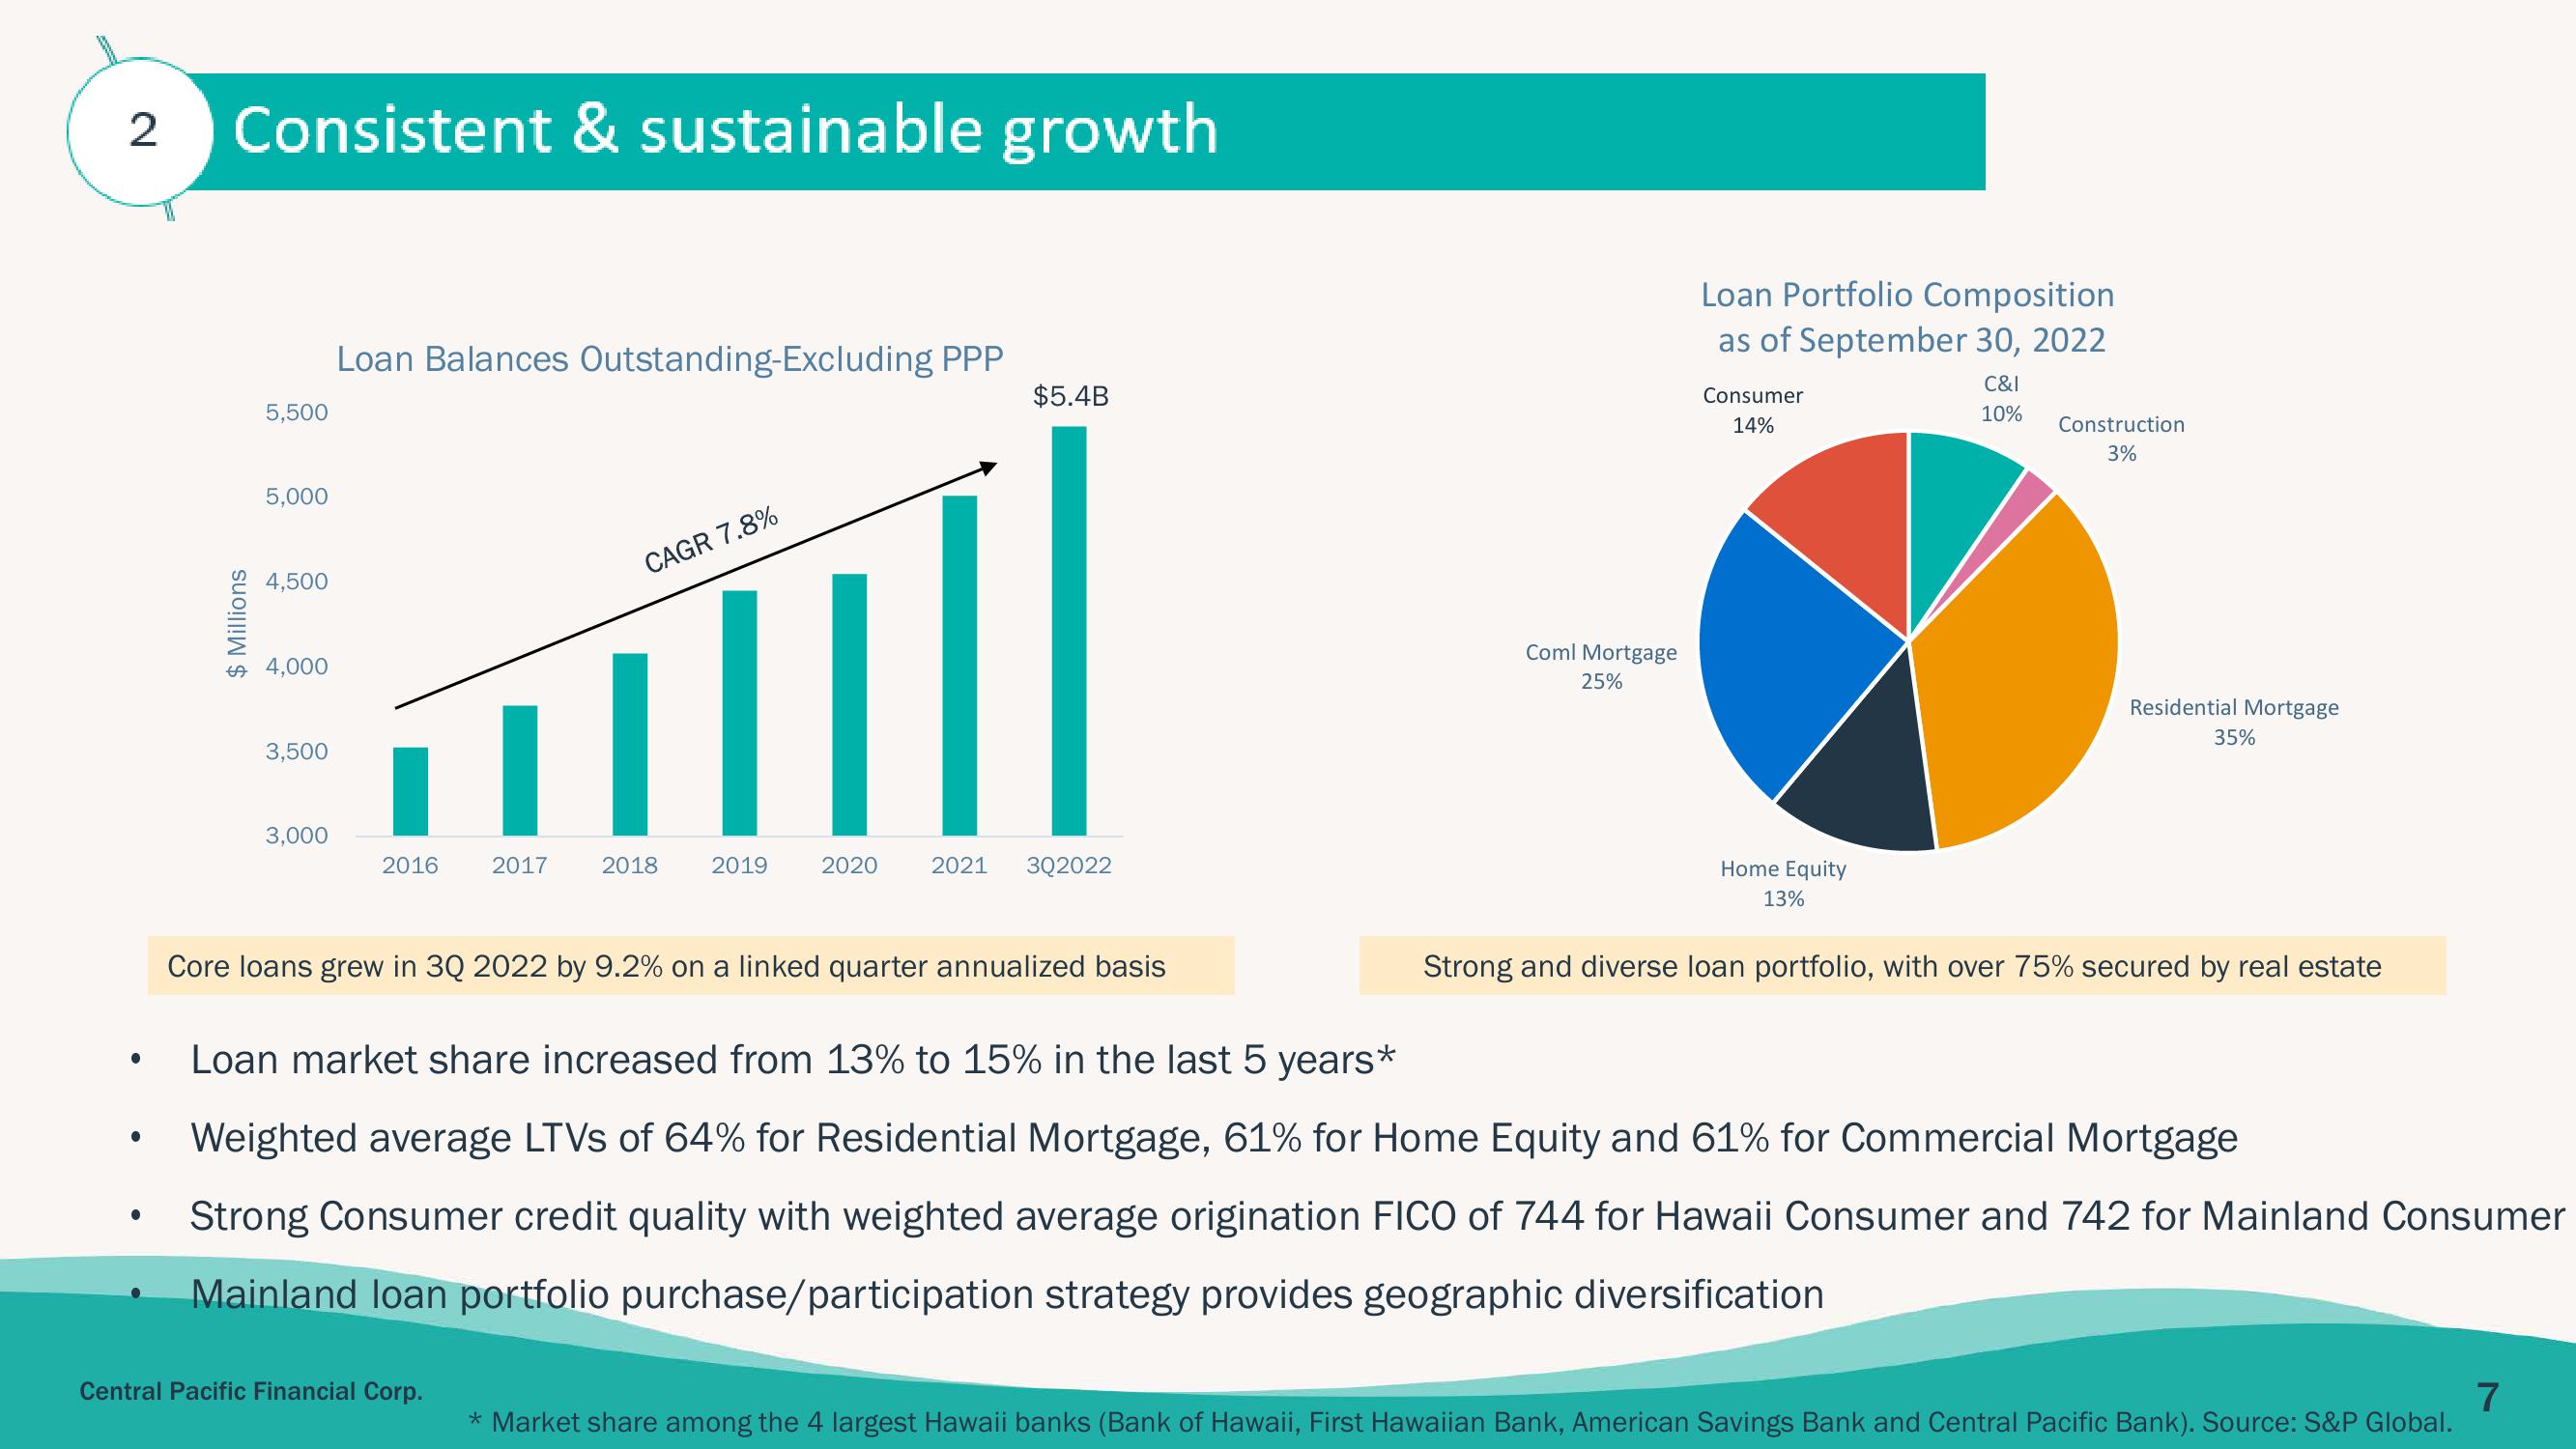
Loan Balances Outstanding-Excluding PPP
2016
2017
CAGR 7.8%
Central Pacific Financial Corp.
2018
2019
2020
$5.4B
2021 302022
Core loans grew in 3Q 2022 by 9.2% on a linked quarter annualized basis
Coml Mortgage
25%
Loan Portfolio Composition
as of September 30, 2022
C&I
10%
Consumer
14%
Construction
3%
Residential Mortgage
35%
Home Equity
13%
Strong and diverse loan portfolio, with over 75% secured by real estate
Loan market share increased from 13% to 15% in the last 5 years*
Weighted average LTVS of 64% for Residential Mortgage, 61% for Home Equity and 61% for Commercial Mortgage
Strong Consumer credit quality with weighted average origination FICO of 744 for Hawaii Consumer and 742 for Mainland Consumer
Mainland loan portfolio purchase/participation strategy provides geographic diversification
* Market share among the 4 largest Hawaii banks (Bank of Hawaii, First Hawaiian Bank, American Savings Bank and Central Pacific Bank). Source: S&P Global.
7View entire presentation