Bionomics Results Presentation Deck slide image

Bionomics Results Presentation Deck

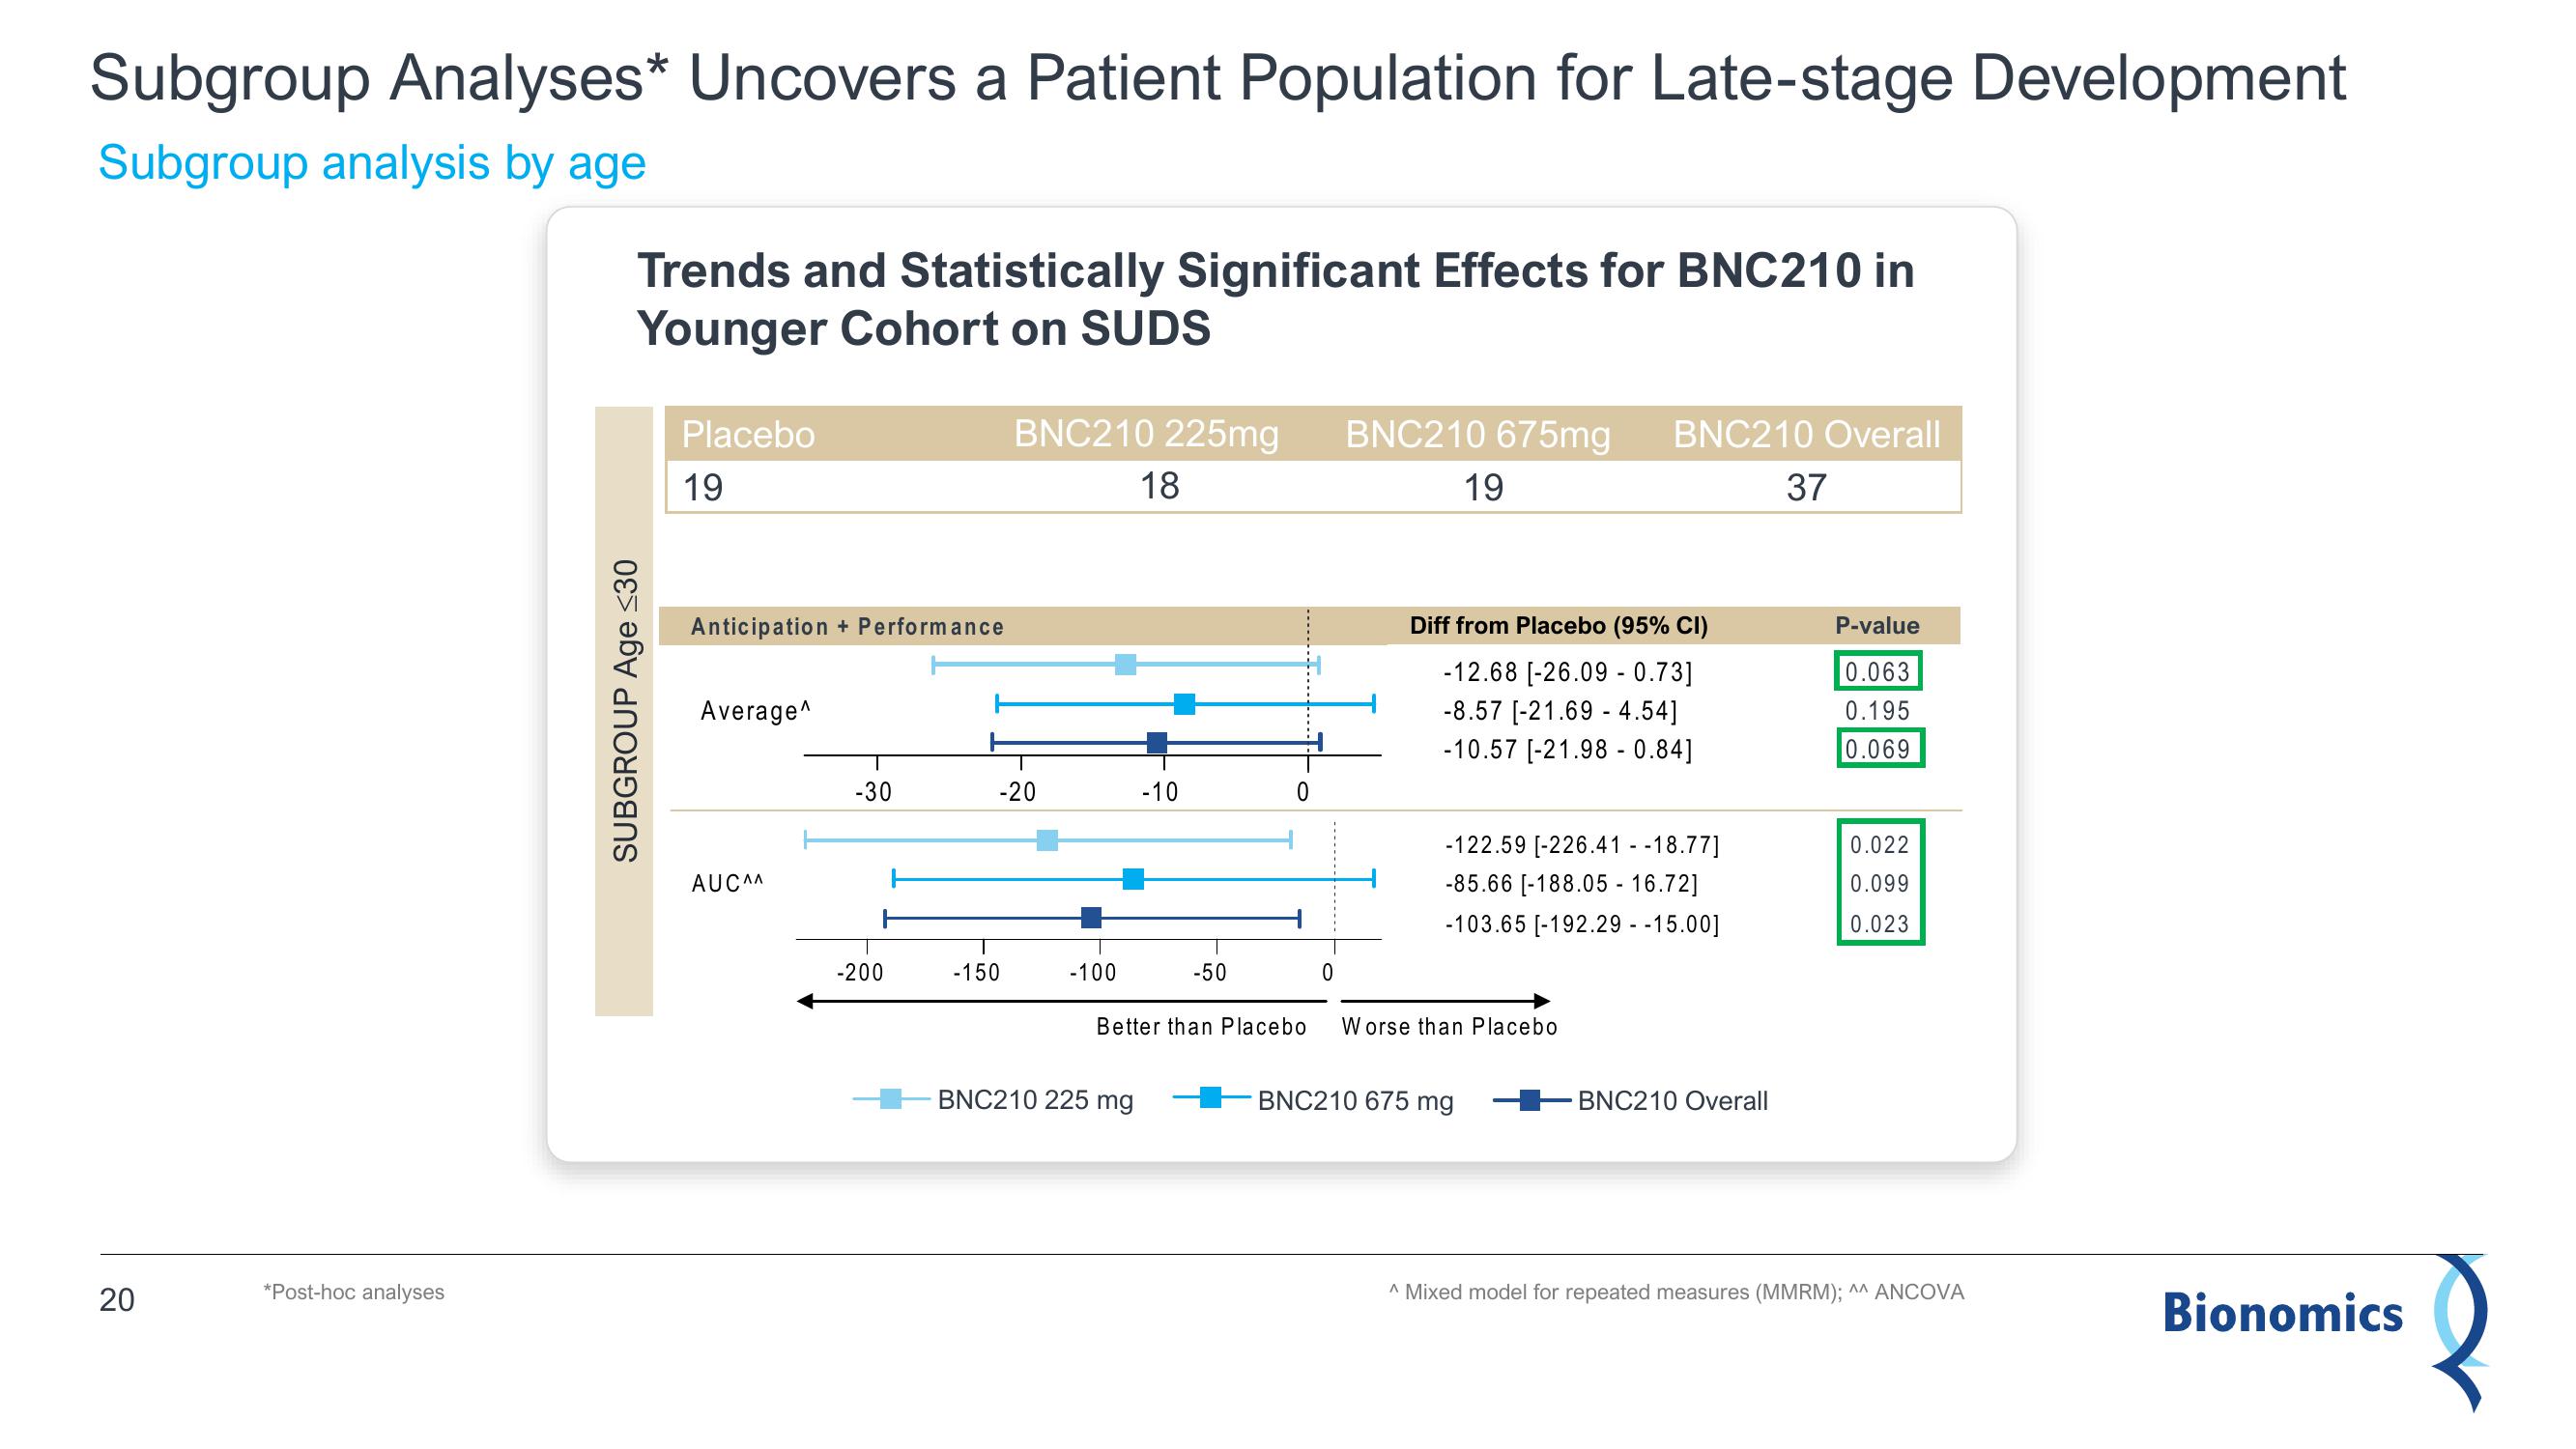
Subgroup Analyses* Uncovers a Patient Population for Late-stage Development Subgroup analysis by age 20 *Post-hoc analyses Trends and Statistically Significant Effects for BNC210 in Younger Cohort on SUDS SUBGROUP Age ≤30 Placebo 19 Anticipation + Performance Average^ AUC^^ -30 -200 -150 BNC210 225mg BNC210 675mg BNC210 Overall 18 37 -20 -100 -10 BNC210 225 mg -50 Better than Placebo 0 19 Diff from Placebo (95% CI) -12.68 [-26.09 -0.73] -8.57 [-21.69 - 4.54] -10.57 [-21.98 - 0.84] -122.59 [-226.41--18.77] -85.66 [-188.05 - 16.72] -103.65 [-192.29 - -15.00] Worse than Placebo BNC210 675 mg BNC210 Overall P-value 0.063 0.195 0.069 0.022 0.099 0.023 ^ Mixed model for repeated measures (MMRM); ^^ ANCOVA Bionomics 2
View entire presentation