Broadridge Financial Solutions Results Presentation Deck slide image

Broadridge Financial Solutions Results Presentation Deck

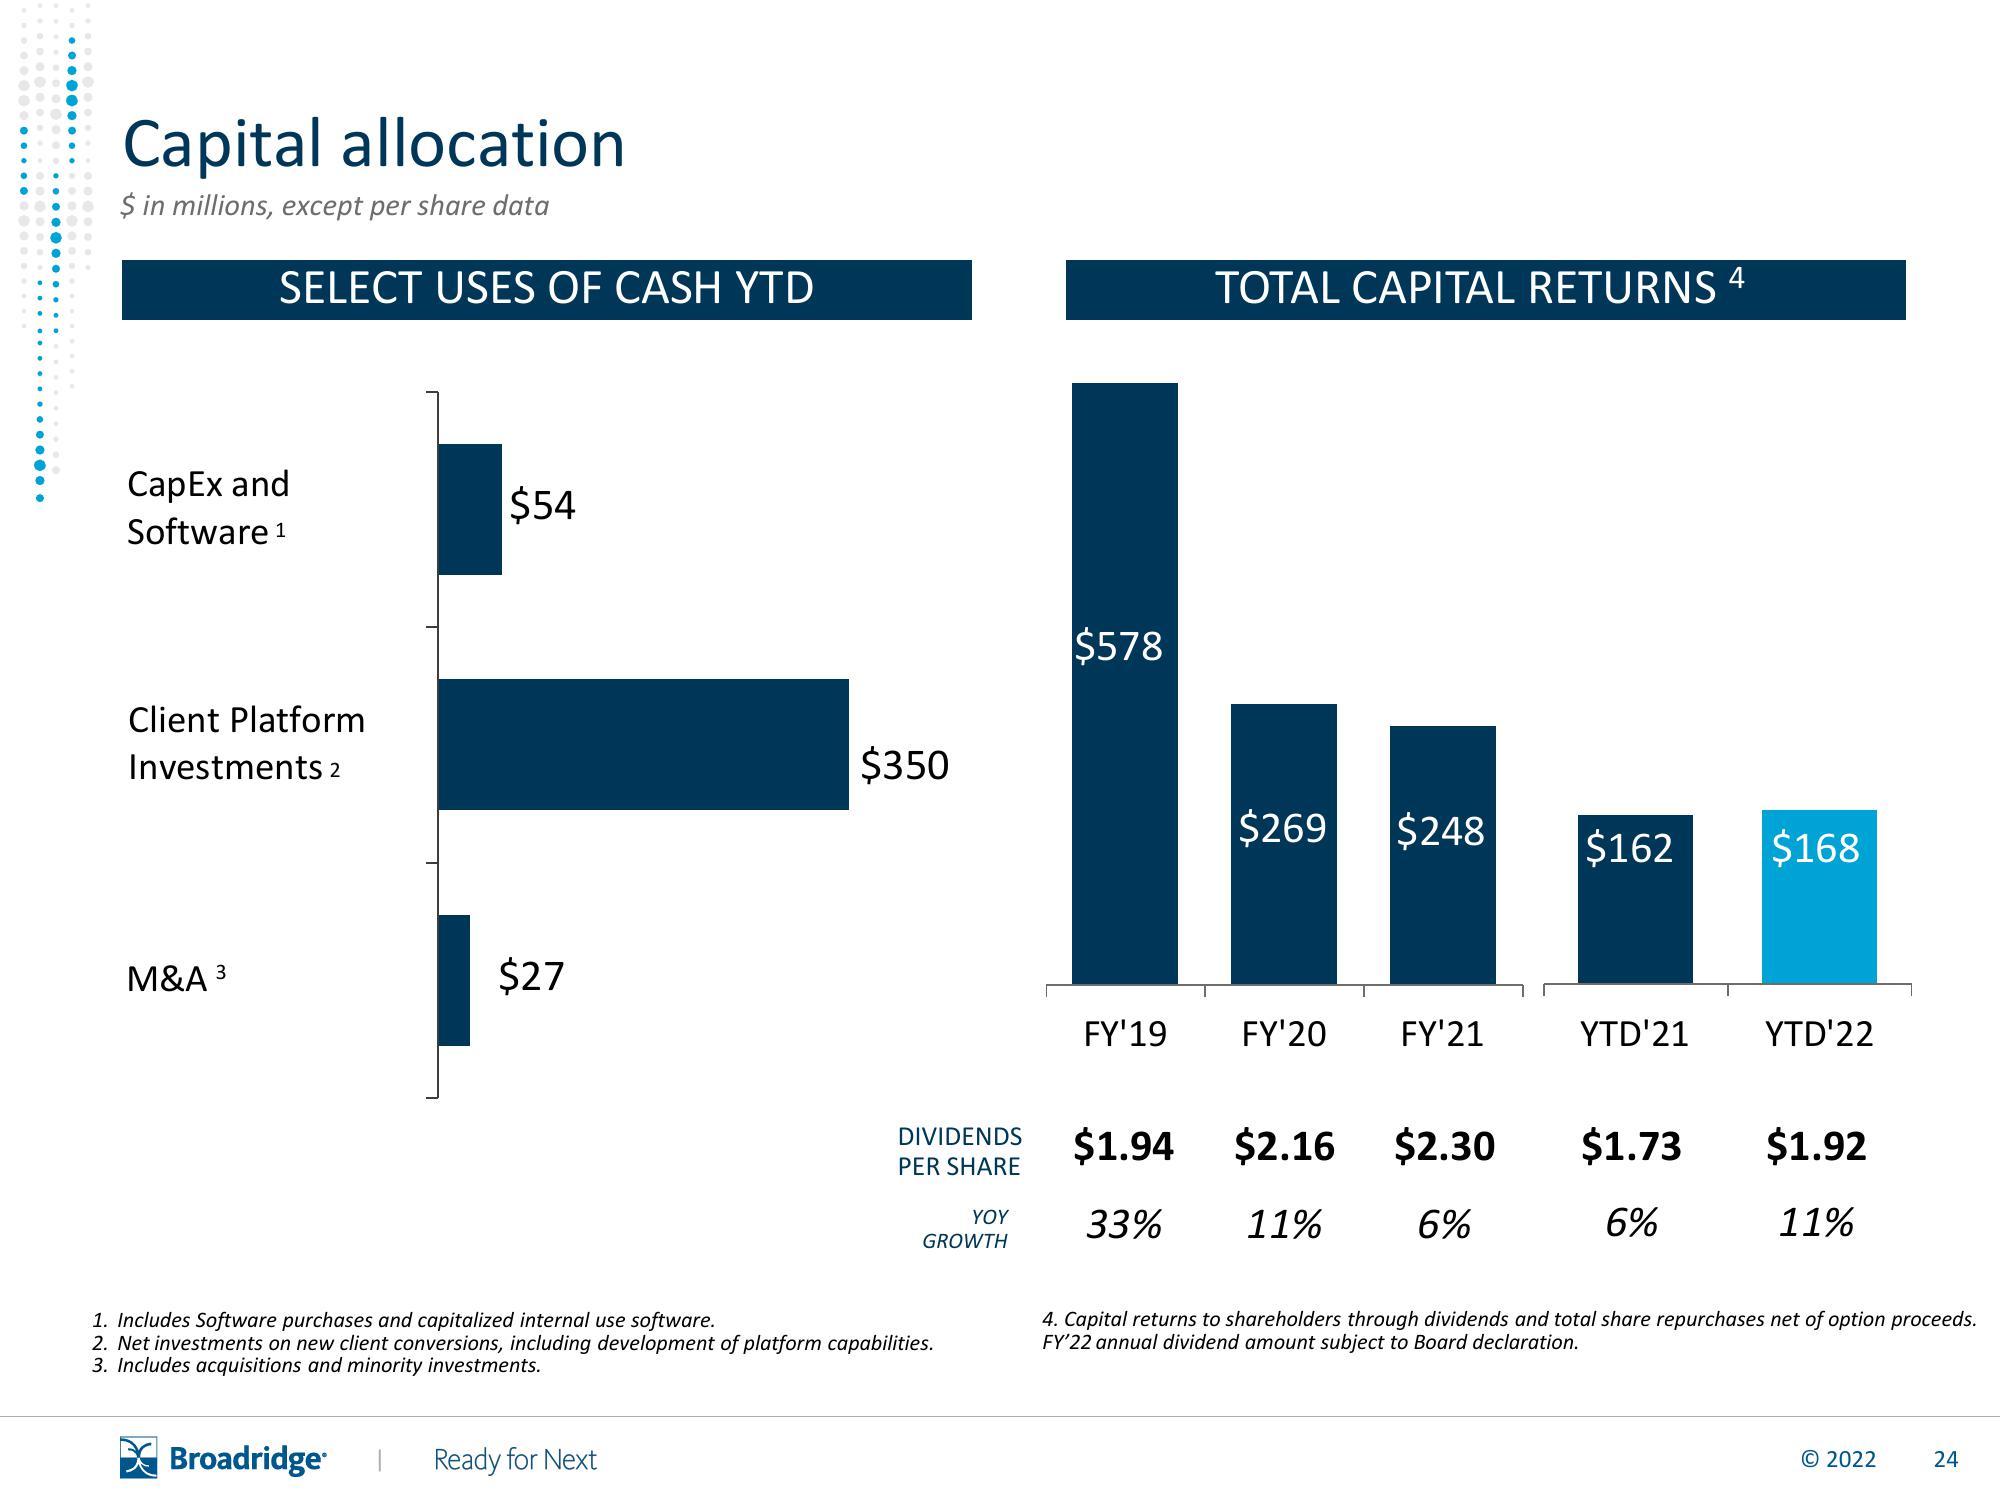
Capital allocation $ in millions, except per share data SELECT USES OF CASH YTD CapEx and Software 1 Client Platform Investments 2 M&A ³ 3 $54 $27 $350 Broadridge I Ready for Next DIVIDENDS PER SHARE YOY GROWTH 1. Includes Software purchases and capitalized internal use software. 2. Net investments on new client conversions, including development of platform capabilities. 3. Includes acquisitions and minority investments. $578 TOTAL CAPITAL RETURNS $1.94 33% FY'19 FY'20 FY'21 $269 $248 $162 $168 $2.16 $2.30 11% 6% 4 YTD'21 YTD'22 $1.73 6% $1.92 11% 4. Capital returns to shareholders through dividends and total share repurchases net of option proceeds. FY'22 annual dividend amount subject to Board declaration. © 2022 24
View entire presentation