Micro Focus Fixed Income Presentation Deck
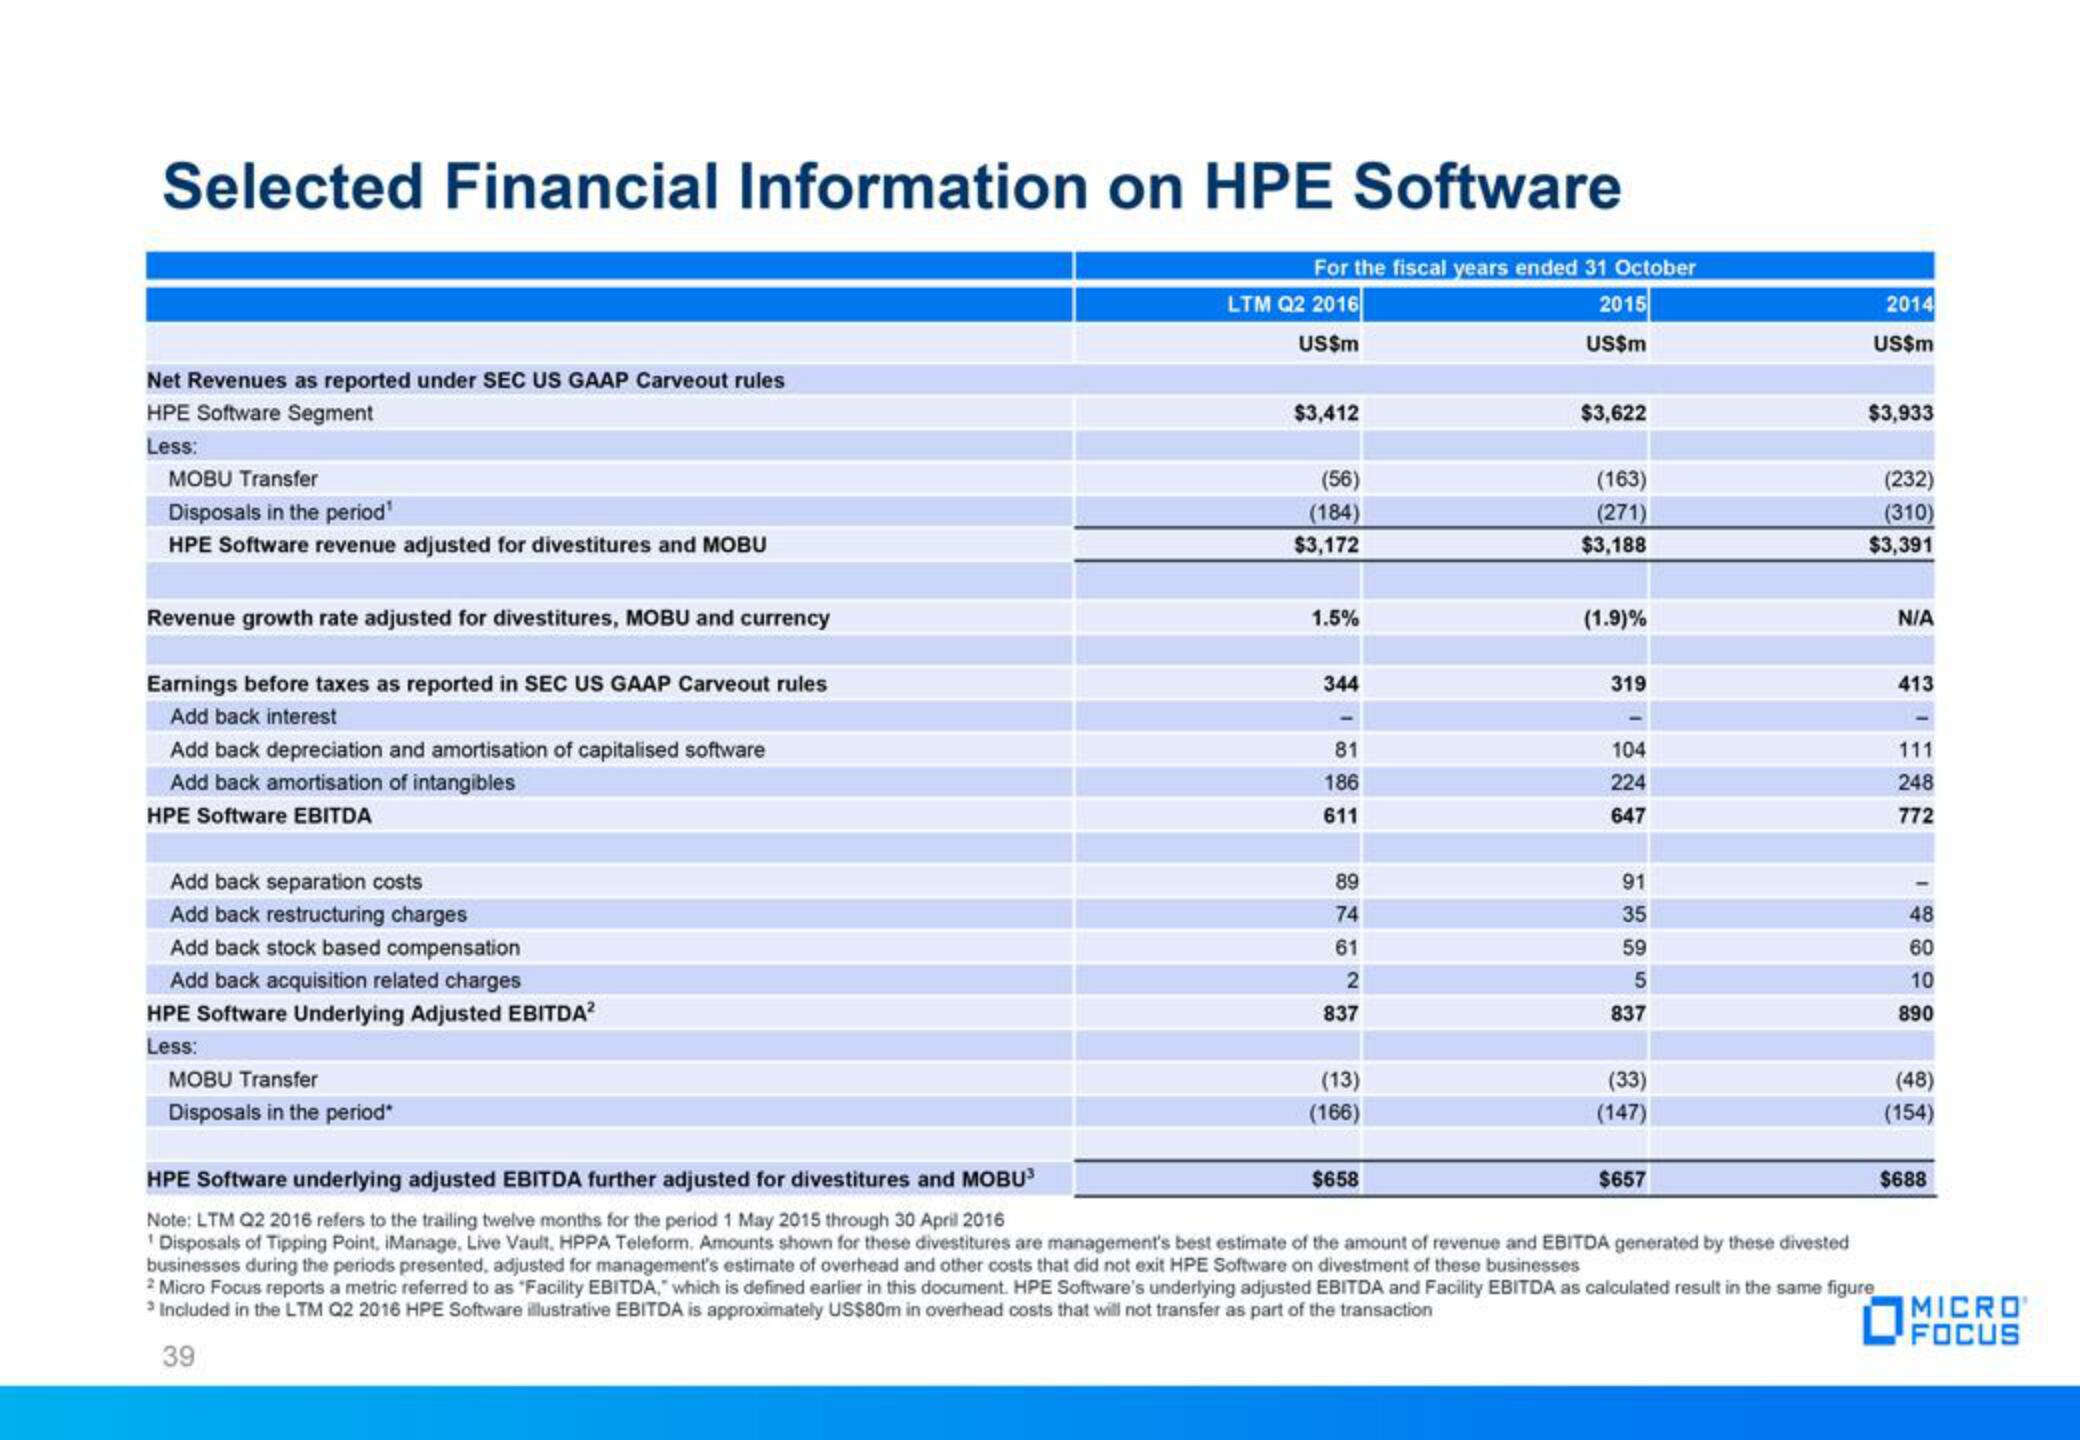
Selected Financial Information on HPE Software
For the fiscal years ended 31 October
Net Revenues as reported under SEC US GAAP Carveout rules
HPE Software Segment
Less:
MOBU Transfer
Disposals in the period¹
HPE Software revenue adjusted for divestitures and MOBU
Revenue growth rate adjusted for divestitures, MOBU and currency
Earnings before taxes as reported in SEC US GAAP Carveout rules
Add back interest
Add back depreciation and amortisation of capitalised software
Add back amortisation of intangibles
HPE Software EBITDA
Add back separation costs
Add back restructuring charges
Add back stock based compensation
Add back acquisition related charges
HPE Software Underlying Adjusted EBITDA²
Less:
MOBU Transfer
Disposals in the period
LTM Q2 2016
US$m
$3,412
(56)
(184)
$3,172
1.5%
344
81
186
611
89
74
61
2
837
(13)
(166)
2015
US$m
$658
$3,622
(163)
(271)
$3,188
(1.9) %
319
104
224
647
91
35
59
5
837
(33)
(147)
2014
US$m
$657
$3,933
HPE Software underlying adjusted EBITDA further adjusted for divestitures and MOBU³
Note: LTM Q2 2016 refers to the trailing twelve months for the period 1 May 2015 through 30 April 2016
'Disposals of Tipping Point, iManage, Live Vault, HPPA Teleform. Amounts shown for these divestitures are management's best estimate of the amount of revenue and EBITDA generated by these divested
businesses during the periods presented, adjusted for management's estimate of overhead and other costs that did not exit HPE Software on divestment of these businesses
2 Micro Focus reports a metric referred to as "Facility EBITDA," which is defined earlier in this document. HPE Software's underlying adjusted EBITDA and Facility EBITDA as calculated result in the same figure
3 Included in the LTM Q2 2016 HPE Software illustrative EBITDA is approximately US$80m in overhead costs that will not transfer as part of the transaction
39
(232)
(310)
$3,391
N/A
413
111
248
772
48
60
10
890
(48)
(154)
$688
MICRO
FOCUSView entire presentation