Coursera Investor Day Presentation Deck
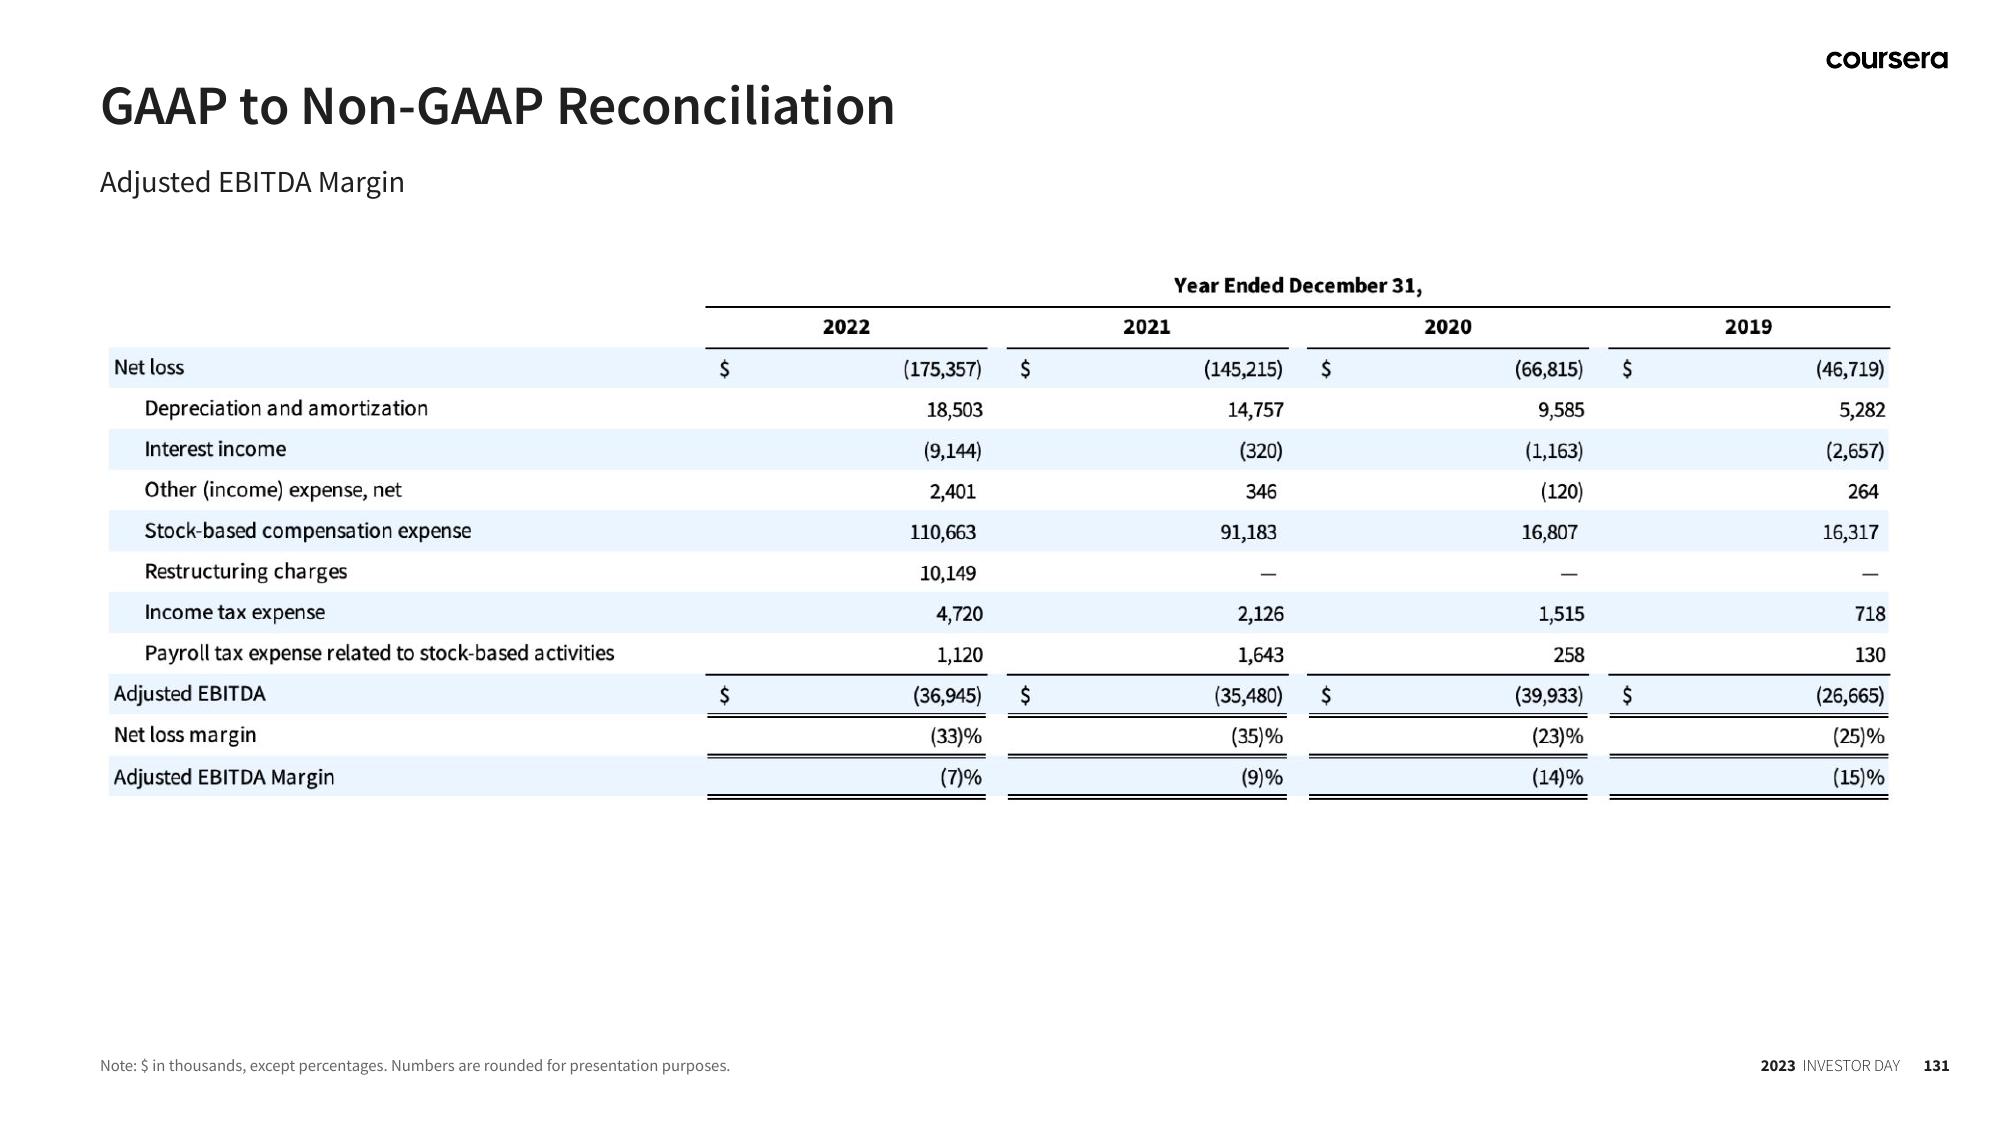
GAAP to Non-GAAP Reconciliation
Adjusted EBITDA Margin
Net loss
Depreciation and amortization
Interest income
Other (income) expense, net
Stock-based compensation expense
Restructuring charges
Income tax expense
Payroll tax expense related to stock-based activities
Adjusted EBITDA
Net loss margin
Adjusted EBITDA Margin
$
$
Note: $ in thousands, except percentages. Numbers are rounded for presentation purposes.
2022
2021
(175,357) $
(145,215) $
18,503
14,757
(9,144)
(320)
2,401
346
[I
110,663
91,183
10,149
4,720
2,126
1,120
1,643
(36,945) $
(35,480) $
(35)%
(9)%
Year Ended December 31,
(33)%
(7)%
2020
(66,815)
9,585
(1,163)
(120)
16,807
-
1,515
258
$
(39,933) $
(23)%
(14)%
2019
coursera
(46,719)
5,282
(2,657)
264
16,317
718
130
(26,665)
(25)%
(15)%
2023 INVESTOR DAY 131View entire presentation