Micro Focus Fixed Income Presentation Deck
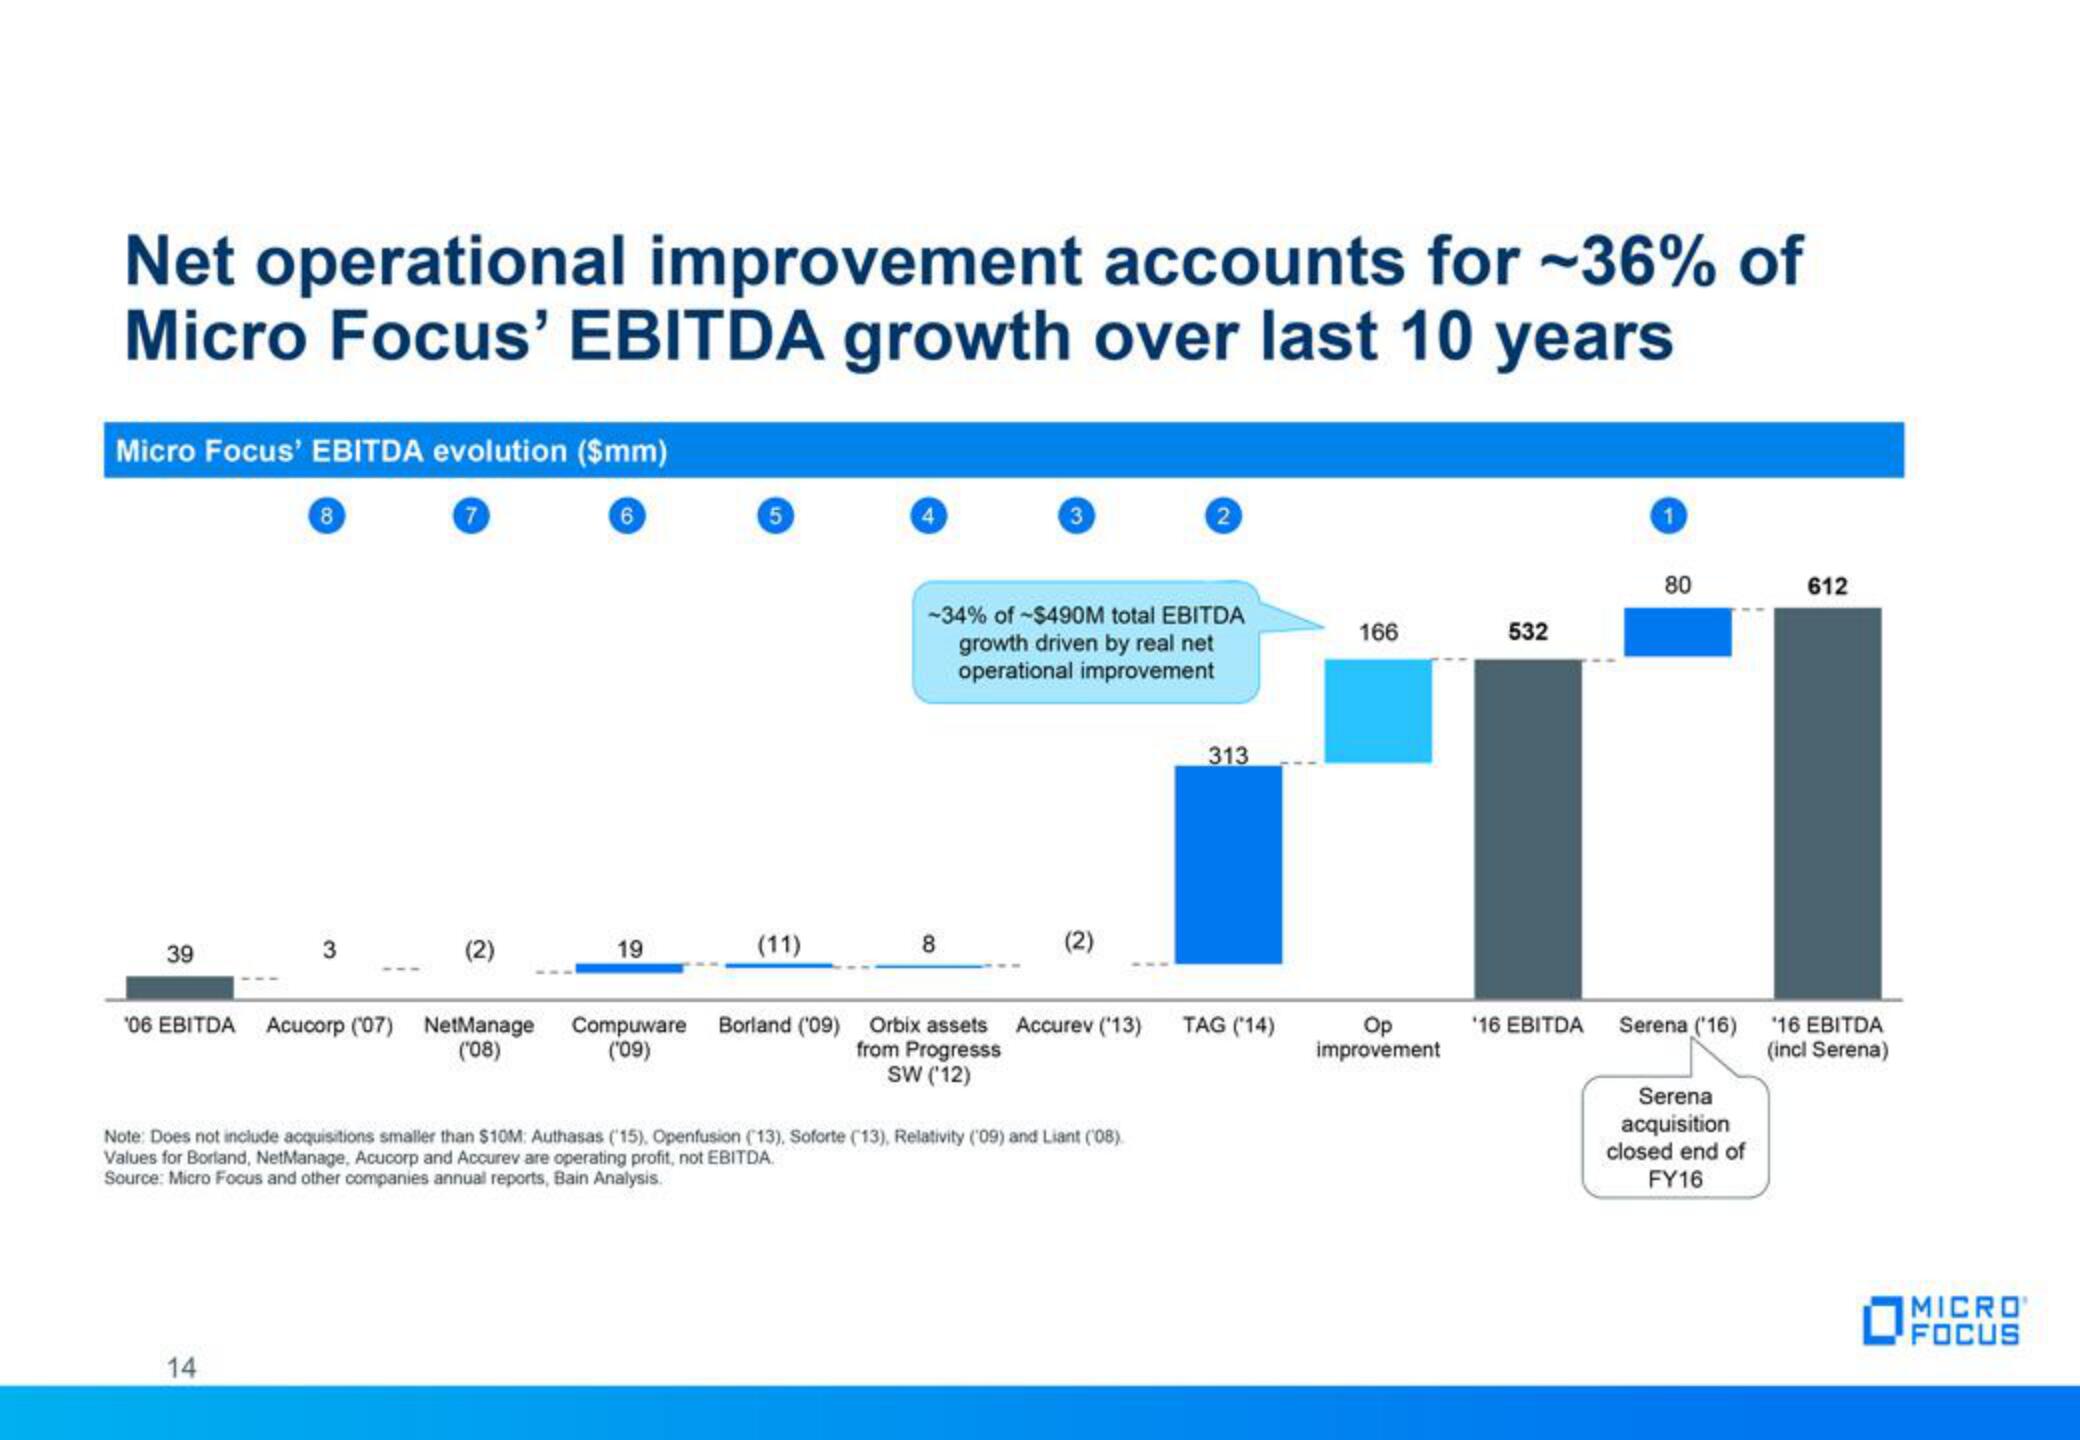
Net operational improvement accounts for -36% of
Micro Focus' EBITDA growth over last 10 years
Micro Focus' EBITDA evolution ($mm)
7
6
39
8
3
14
(2)
'06 EBITDA Acucorp (07) NetManage
('08)
19
Compuware
('09)
(11)
-34% of -$490M total EBITDA
growth driven by real net
operational improvement
8
Borland (09) Orbix assets
from Progresss
SW ('12)
(2)
Accurev ('13)
Note: Does not include acquisitions smaller than $10M: Authasas (15), Openfusion (13), Soforte (13), Relativity (109) and Liant (08)
Values for Borland, NetManage, Acucorp and Accurev are operating profit, not EBITDA.
Source: Micro Focus and other companies annual reports, Bain Analysis.
166
532
T
'16 EBITDA
313
TAG (14)
80
Op
improvement
Serena (16)
Serena
acquisition
closed end of
FY16
612
'16 EBITDA
(incl Serena)
MICRO
FOCUSView entire presentation